Tracking LTV From Email Campaigns in Beauty Shopify Stores: A Practitioner Playbook
If you run CRM or growth for a beauty Shopify store, you don’t need another primer on what LTV is—you need a reliable way to connect email touches to repeat orders and quantify lifetime value by cohort, flow, and campaign. In Shopify terms, think of LTV as a practical metric you can actually act on: average order value multiplied by purchase frequency over a chosen horizon, optionally profit‑adjusted when you’re making margin decisions. Shopify lays out common CLV variants and assumptions in its 2025 overview, which is a good reference point for definitions and trade‑offs in modeling assumptions according to the Shopify guide to customer lifetime value (2025).
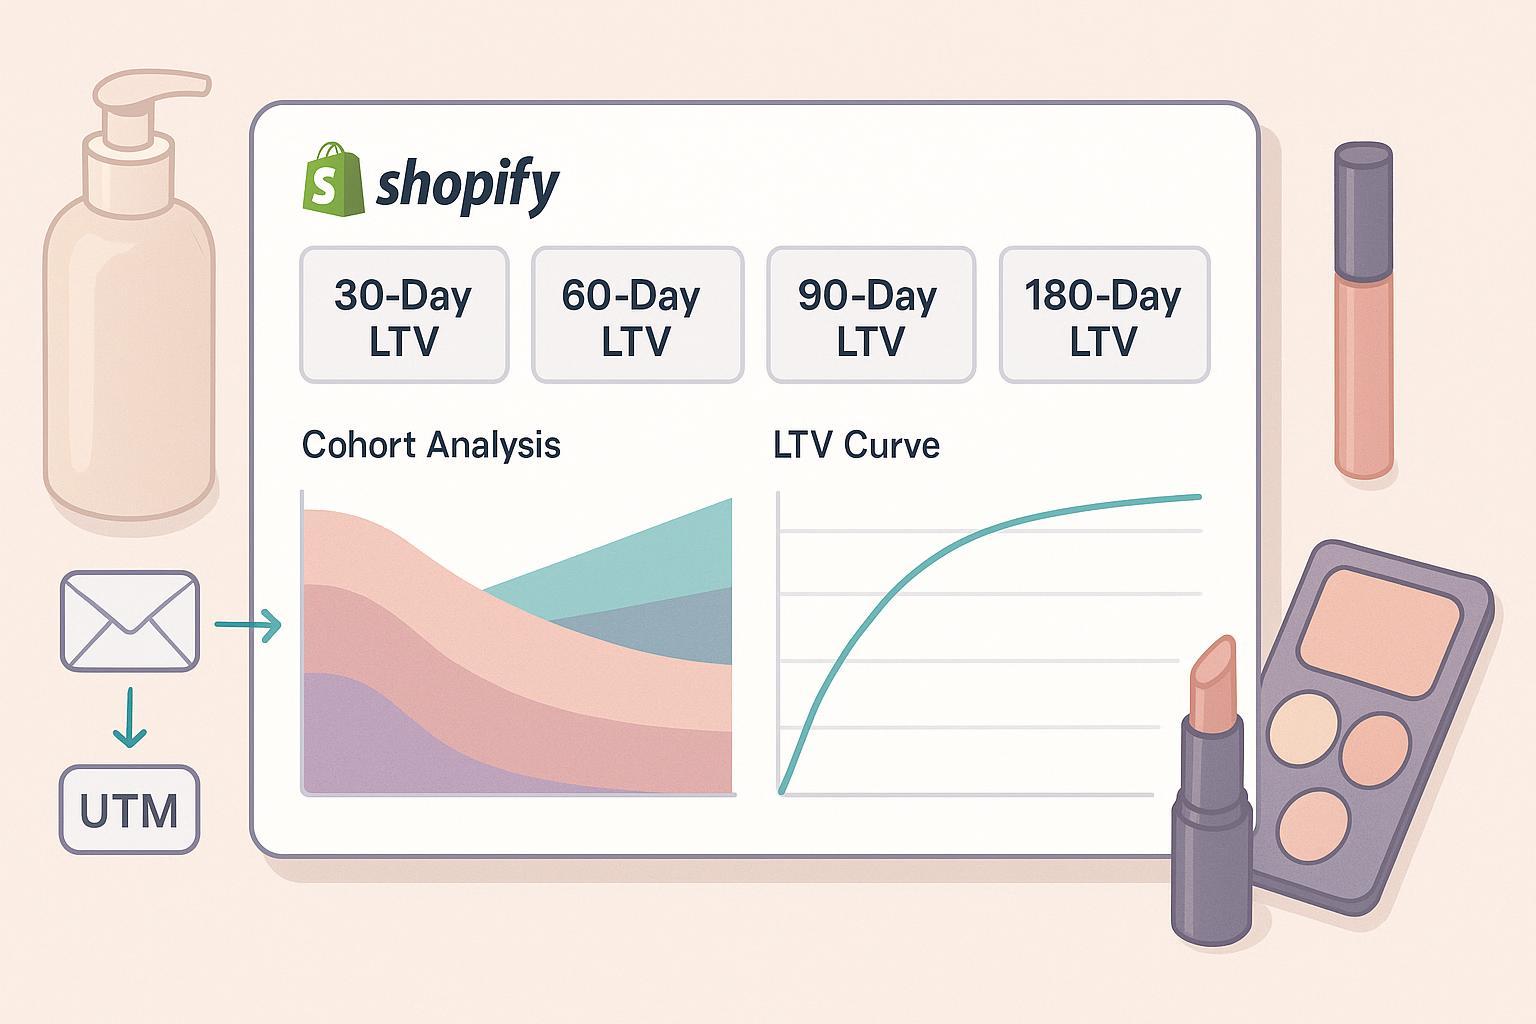
This playbook shares the end‑to‑end workflow we use with beauty brands: how to tag email clicks precisely, capture consent‑aware purchase events, stitch identities, build dashboards for 30/60/90/180‑day LTV, and validate incrementality—while calling out beauty‑specific nuances (replenishment cycles, regimen progressions, shade matching) that materially change how you measure success.
1) The end‑to‑end tracking blueprint
In practice, accurate LTV from email requires four pillars working in concert: link governance, event capture, identity resolution, and consistent timekeeping.
1.1 UTM and identifier governance inside your ESP
Treat UTMs like a data contract between your ESP and every downstream system.
- Auto‑append UTMs at the account level and standardize values you’ll analyze later:
- utm_source=email, utm_medium=email
- utm_campaign={{ campaign_name or flow_name }}
- utm_content={{ variation or message slug }}
- utm_id={{ message_id }} (critical for tying orders back to a specific send)
- Klaviyo supports account‑level UTM settings and custom parameters; implement a convention once and reuse everywhere. Their documentation walks through setup and common patterns in Klaviyo UTM tracking.
- Lock your naming rules in a shared doc. Decide how you’ll name welcome vs. replenishment vs. win‑back flows, and how you’ll encode offer type (e.g., 10off, gwp, none) in utm_content.
Why the rigor? Because LTV analysis lives or dies by cohort fidelity. Six months from now, you’ll want to answer “What was 180‑day LTV for first‑time buyers exposed to the Vitamin‑C welcome flow vs. the SPF replenishment series?” You can’t ask that if your source data is noisy.
1.2 Attribution windows and signal hygiene
- Establish your attribution window and don’t change it casually. Klaviyo allows you to adjust lookback, exclude Apple Mail Privacy Protection opens, and filter bot clicks; these settings materially affect which sends “get credit.” See the current controls in Klaviyo’s guidance on changing your attribution model and excluding bot/MPP traffic. If you alter settings, log the date and rationale so reporting doesn’t “mysteriously” shift.
- Prefer click‑based attribution in MPP‑heavy lists. Opens are noisy; LTV analysis is better grounded in clicks and orders.
- QA every send: spot‑check links, confirm UTMs populate as expected, and verify that your destination URLs don’t strip parameters (test on mobile and desktop).
1.3 Shopify‑side, privacy‑resilient event capture
Client‑side cookies are fragile. Make your tracking durable and consent‑aware.
- Implement Shopify Web Pixels/Customer Events so standard events (page_view, product_viewed, checkout_completed) are emitted in a sandboxed, first‑party context. Shopify documents the pixel mutation and event shape in the Admin GraphQL for webPixelUpdate. This improves reliability under ITP/ad‑blocking.
- Where feasible, complement browser events with server‑side forwarding to analytics/ad endpoints (e.g., GA4, CAPI). A practical overview of server‑side tracking trade‑offs for Shopify is outlined in Analyzify’s server‑side tracking foundations. Deduplicate events so you don’t double‑count.
- Honor consent. Ensure your CMP’s categories align with event types so purchase tracking is not blocked unintentionally.
1.4 Identity stitching that survives real life
- Anchor on email address and Shopify customer ID; ensure the ESP’s profile merges cleanly handle duplicates and aliases.
- Pass a stable message identifier (utm_id) on every link; let downstream tools join orders back to sends, even across devices.
- For visitors who browse logged‑out then purchase logged‑in, onsite product and cart events (e.g., Klaviyo’s Viewed Product/Added to Cart) often help resolve identity to a known profile later.
1.5 Time zone normalization (don’t skip this)
- Align time zones across Shopify, your ESP, GA4, and any BI tool. Store timestamps in UTC in your warehouse and convert to store time for reporting. Mismatches are a frequent cause of “missing orders,” described in Supermetrics’ note on Shopify time zone discrepancies.
2) Beauty‑specific modeling and flows that change LTV math
Beauty is replenishment‑driven, shade‑sensitive, and routine‑oriented. That means your cohorts, triggers, and measurement windows should reflect actual product usage rather than arbitrary 30‑day cycles.
- Derive replenishment windows from your own data. For each SKU or product family, measure median days‑to‑reorder for second and third purchases. Use those medians (or percentiles) to time replenishment sequences and to set observation windows for LTV analysis.
- Model LTV by product family and regimen stage. A serum buyer behaves differently than an SPF buyer. Create cohorts by first‑purchase category and compare 30/60/90/180‑day LTV and repeat rate.
- Segmentation recipes that map to measurable outcomes:
- Regimen progressions: cleanser → toner → serum → moisturizer → SPF. Trigger cross‑sells 3–7 days after delivery; measure time‑to‑second‑order.
- Concern‑based: acne, sensitivity, anti‑aging. Personalize content and cadence; measure cohort retention curves.
- Shade/tone memory for color cosmetics: store shade and undertone; trigger replenishment as predicted depletion nears (e.g., 60–90 days for daily lipstick users). Track incremental LTV vs. a generic replenishment.
- Define success beyond revenue per send. Use LTV deltas, repeat purchase rate, and time‑to‑second‑order as your primary success metrics for lifecycle flows.
3) Dashboards and metrics that matter (and where to build them)
The key is to make cohort‑based LTV by email touch visible, fast, and trusted.
What to chart, at minimum:
- LTV by cohort and email touch: 30/60/90/180‑day cumulative revenue per customer for cohorts first exposed to a given campaign/flow.
- Repeat‑purchase rate and time‑to‑second‑order by cohort and product family.
- Retention curves by cohort (percentage of cohort with at least N orders over time).
- Contribution analysis: share of total LTV by lifecycle flow (welcome, replenishment, cross‑sell, win‑back).
Where to build it:
- Shopify’s rebuilt analytics experience now includes a Customer cohort analysis and predicted spend tiers, per Shopify’s June 2025 changelog on customer cohort analysis in the new analytics. Use it for quick, native retention views; export if you need custom LTV math.
- GA4 Explorations provide cohort and lifetime value views if your ecommerce tagging is robust. Start with the Lifetime and Cohort templates described in Google’s GA4 explorations overview and filter by utm_source/medium to isolate email.
- Shopify‑native LTV tools can accelerate this:
- Triple Whale offers cohorts and LTV breakdowns aligned to spend and channels; see their Shopify app overview for capabilities on the Triple Whale app page.
- Lifetimely and similar tools focus on profit‑centric LTV, cohorting, and RFM—useful when contribution margin is your north star. Even if you don’t link out, evaluate features against your needs: cohort flexibility, flow/campaign tagging, and export options.
Operational tips:
- Standardize horizons. Pick 30/60/90/180 days and stick to them across teams.
- Show variance, not just averages. For beauty, LTV distributions are skewed; medians and percentile bands tell a truer story than means alone.
- Keep "last change" notes. Any attribution setting change, pixel swap, or ESP migration should be noted directly on the dashboard or a linked changelog.
4) Experimentation: proving incremental LTV from email
Attribution tells you who touched what; experiments tell you what actually moved lifetime value. For flows that materially shape the lifecycle (welcome, replenishment, win‑back), run periodic holdout tests.
A pragmatic design:
- Randomize within your marketable audience. Assign 10–20% to holdout for a specific flow or campaign. Ensure they’re excluded from all related sends for the duration.
- Observation windows that match your replenishment cadence: 90–180 days for skincare; you can also report interim 30/60‑day deltas.
- Outcomes: per‑user LTV, repeat‑purchase rate, and time‑to‑second‑order. Segment analyses by first product family and prior purchase frequency.
- Power and sample size: aim for ≥10k recipients per cell if feasible; smaller lists can still run directional tests but expect wider confidence intervals.
- Implementation: Klaviyo supports random sampling on lists/segments and branching flows for A/B; pair that with a strict exclusion segment for your holdout. For a practical foundation on email test design and pitfalls, see Litmus’ primer on email A/B testing and adapt for longer windows.
Interpretation notes:
- Treat incrementality as a long‑horizon KPI. Short‑term revenue per send can disagree with long‑term LTV; trust the holdout.
- Re‑run quarterly. Consumer behavior and privacy rules shift; your best flow today may decay without iterative tuning.
5) Neutral, real‑world example: enriching email flows with event data
When we’ve implemented unified identifiers and consent‑aware event capture, we’ve seen teams unlock both better flow logic and cleaner LTV measurement. One instance involved connecting enriched onsite and purchase events to Klaviyo flows so replenishment and cross‑sell timing reflected real usage signals. We used Attribuly to unify journey data and stream structured events into Klaviyo, which improved measurement and flow targeting. Disclosure: Attribuly is our product.
For readers who want to see a concrete outcome, the Sylvox mini‑case outlines how enriched events and attribution improved email revenue and measurement clarity in practice; details are summarized in this short read: Attribuly × Sylvox case study. The key takeaway for your stack—regardless of tool choice—is to pass stable identifiers (message/order/customer), maintain your UTM contract, and feed flows with trustworthy product and lifecycle signals. That combination is what makes cohort‑level LTV analysis credible six months later.
6) Troubleshooting: fix the gaps that quietly break LTV
Most LTV discrepancies trace back to a handful of causes. Here’s how to diagnose them quickly.
-
Inconsistent or missing UTMs
- Symptom: “Direct/none” orders, unknown campaigns, or sudden shifts in email‑attributed revenue.
- Fix: Enforce account‑level auto‑UTM in your ESP; QA links before every send; restrict manual overrides to emergencies. Use consistent casing and values.
-
Attribution setting changes
- Symptom: A flow “loses” credit overnight.
- Fix: Keep a change log. If you adjust lookback windows or exclude MPP/bot traffic in Klaviyo, annotate the date and expected direction of impact. The settings and implications are covered in Klaviyo’s model controls reference linked earlier.
-
Consent blocking and pixel duplication
- Symptom: Missing purchase events, double counts, or conflict between browser and server events.
- Fix: Align CMP categories to event types; audit for duplicate pixel installations after theme/app changes; deduplicate server‑ and client‑side events via IDs/hashing rules.
-
Time zone mismatch
- Symptom: Orders appear a day off, UTM touchpoints misaligned.
- Fix: Normalize to UTC in data stores and convert for display; verify store vs. API time bases as flagged in the Supermetrics guidance referenced above.
-
Identity resolution gaps
- Symptom: Known customers show up as new or email clicks fail to tie to orders.
- Fix: Merge duplicate profiles in your ESP; ensure utm_id carries the message identifier; enable onsite product/cart events to strengthen linkage from anonymous sessions to known profiles later.
-
GA4 under‑reporting vs. Shopify
- Symptom: Fewer purchases in GA4.
- Explanation: GA4 is session‑based and consent‑dependent; treat Shopify as your order source of truth and use GA4 for exploration and directional trends, not authoritative revenue totals.
7) Copy/paste QA checklist before you ship your next flow
Governance
- [ ] Documented UTM schema (source, medium, campaign, content, id) and applied at account level
- [ ] utm_id carries a stable message identifier from the ESP
- [ ] ESP naming conventions cover flow type, offer type, and campaign variants
Events and identity
- [ ] Shopify Web Pixels/Customer Events enabled; standard events verified in live preview
- [ ] If using server‑side forwarding, deduplication rules tested end‑to‑end
- [ ] Consent categories mapped; events respect CMP choices
- [ ] Onsite Viewed Product/Added to Cart events populate in the ESP and link to profiles
Attribution and timekeeping
- [ ] Click‑based attribution preferred in MPP‑heavy lists; MPP opens excluded
- [ ] Bot click filtering on; lookback windows documented
- [ ] Time zones aligned across Shopify, ESP, GA4, BI; UTC stored; local shown in dashboards
Dashboards and analysis
- [ ] LTV by cohort and email touch at 30/60/90/180 days
- [ ] Repeat‑purchase rate and time‑to‑second‑order by first product family
- [ ] Retention curves visualized; variance bands included
- [ ] Dashboard change log maintained
Experimentation
- [ ] Holdout share and exclusion rules configured for key flows
- [ ] Observation window matches replenishment cadence (≥90 days)
- [ ] Outcomes tracked: per‑user LTV, repeat‑rate, time‑to‑second‑order
8) Putting it all together: a sustainable operating rhythm
-
Monthly
- Validate UTMs on top‑performing flows and new campaigns
- Review 30/60‑day LTV and time‑to‑second‑order by first product family
- Audit pixel health and consent logs after theme/app updates
-
Quarterly
- Run a replenishment or win‑back flow holdout for 90–180 days
- Refresh cohort dashboards; re‑benchmark against last quarter’s medians/percentiles
- Re‑assess attribution settings in light of privacy changes and list composition
-
Semi‑annually
- Re‑derive replenishment windows by SKU from order intervals
- Retire under‑performing branches and expand winners with new content/offer tests
- Evaluate tooling fit (native analytics, GA4, Triple Whale/Lifetimely, warehouse BI) against the next 12 months of roadmap questions
References and further reading (selective)
- Definitions and modeling trade‑offs: Shopify’s 2025 primer on CLV, “How To Calculate Customer Lifetime Value,” available via the Shopify guide to customer lifetime value (2025)
- UTM governance: setup and conventions in Klaviyo UTM tracking
- Attribution settings: MPP/bot exclusions and lookback in Klaviyo attribution model controls
- Shopify privacy‑resilient events: pixel mutation reference webPixelUpdate
- Server‑side overview: Analyzify’s server‑side tracking foundations
- Time zone pitfalls: Supermetrics note on Shopify time zone discrepancies
- Native cohort analysis: Shopify changelog on customer cohort analysis in the new analytics
- GA4 explorations: Google’s GA4 explorations overview
- LTV/cohort tool example: Triple Whale app page
Final thought
LTV from email isn’t a report—it’s a system. When your UTMs are governed, events are consent‑aware and deduplicated, identities are stitched, and your dashboard horizons are consistent, the “what should we do next?” becomes obvious: reinforce the flows that improve time‑to‑second‑order and long‑horizon LTV, and keep testing the rest. Beauty rewards brands that match cadence to real usage—your measurement should, too.
