Understanding the Impression to Conversion Percentage: Key Metrics for Digital Marketing Success
If you buy media on Meta, Google, TikTok, or display networks, you’ve likely seen conversion rates that don’t line up across platforms and GA4. A big reason: some tools calculate “conversion rate” per click or visit, while others let you measure conversions per impression. This article defines Impression to Conversion Percentage, how to calculate it correctly, when to include view‑throughs, and how to reconcile results in a 2025, privacy‑first stack.
What is Impression to Conversion Percentage?
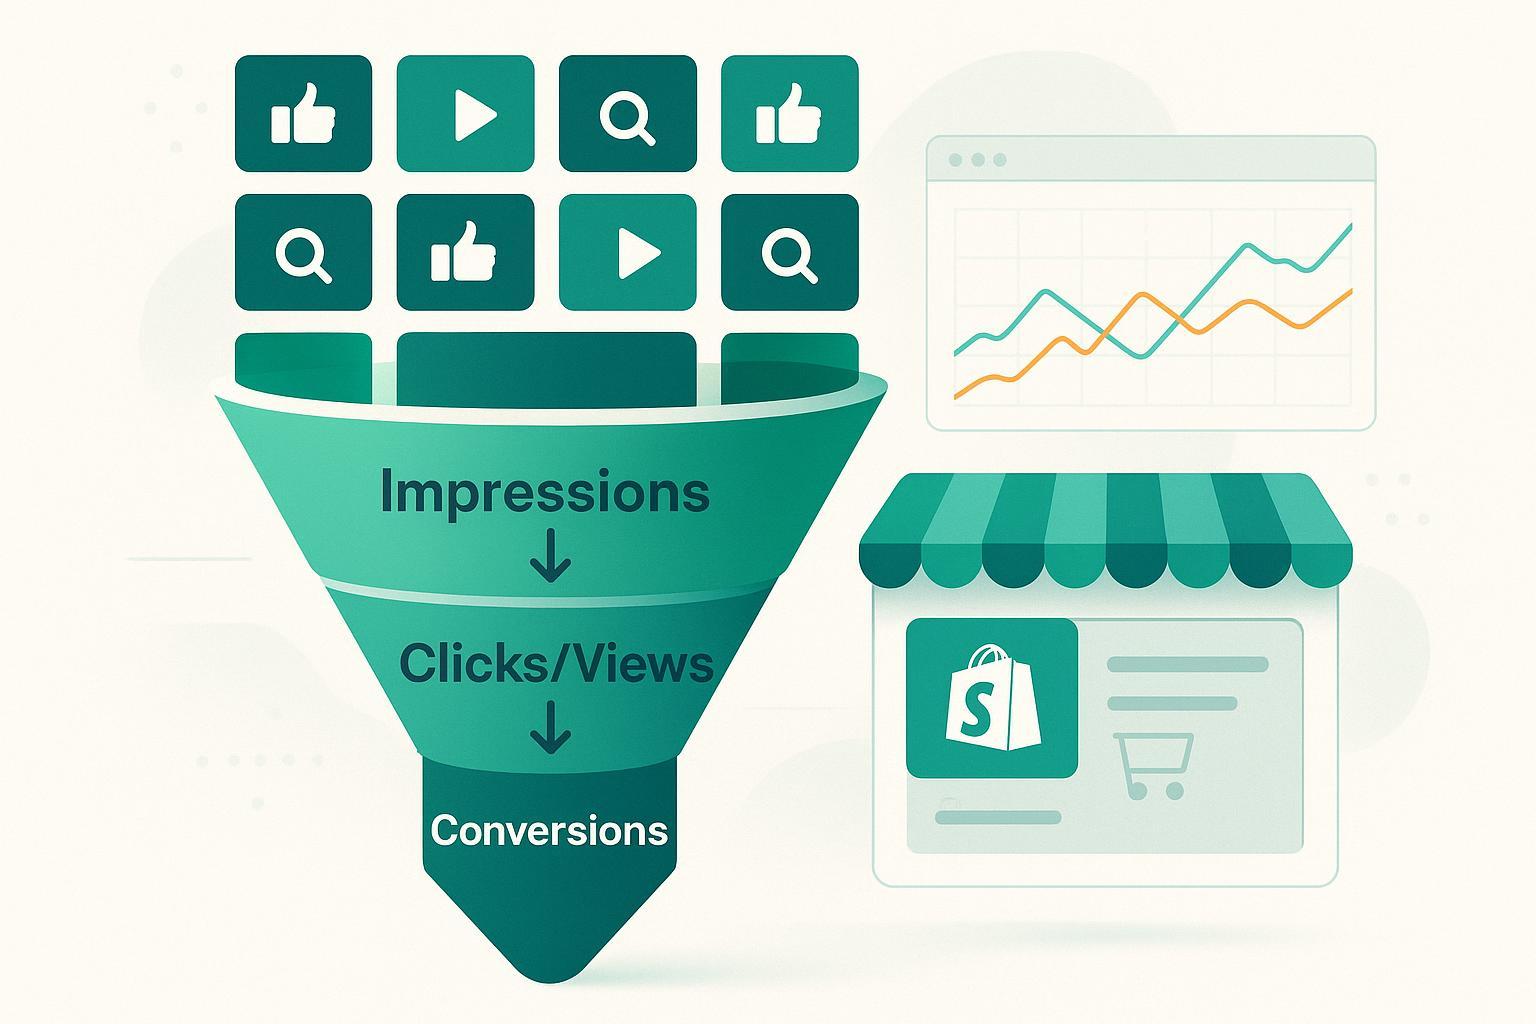
- Plain definition: the share of ad impressions that eventually result in a conversion. Formula: conversions ÷ impressions × 100%.
- Analogy: think of impressions as cars passing a billboard. Clicks are the drivers who pull over to inspect the store window. Conversions are the people who actually buy. Impression to Conversion Percentage asks: out of all passersby, how many ended up purchasing?
Why it matters
- It normalizes performance for campaigns where clicks are scarce (e.g., video, display, upper‑funnel social) but conversions still happen after an exposure.
- It pairs naturally with CPM and CPA to judge efficiency and scale.
How it differs from other familiar metrics
- Not the classic website conversion rate (conversions ÷ visits/sessions).
- Not ad platform “CVR” when CVR is defined as conversions ÷ clicks.
- Not CTR (clicks ÷ impressions). CTR explains how many stop to look; Impression to Conversion explains how many end up buying at all.
Formulas you’ll actually use
- All‑in percentage (counting both click‑through and view‑through conversions): (CTC + VTC) ÷ Impressions × 100%
- Click‑only percentage: CTC ÷ Impressions × 100%
- View‑through‑only percentage: VTC ÷ Impressions × 100%
- Conversions per 1,000 impressions (CPTI): Conversions ÷ Impressions × 1,000
A quick worked example (Shopify context)
- Inputs: 2,000,000 impressions; 800 click‑through conversions; 400 view‑through conversions
- All‑in percentage: (1,200 ÷ 2,000,000) × 100% = 0.06%
- Click‑only percentage: (800 ÷ 2,000,000) × 100% = 0.04%
- CPTI (all‑in): 1,200 ÷ 2,000,000 × 1,000 = 0.6 per 1,000
- Tying to cost: Total cost = (Impressions ÷ 1,000) × CPM. If CPM = $8, total cost = (2,000,000 ÷ 1,000) × $8 = $16,000. All‑in CPA ≈ $16,000 ÷ 1,200 = $13.33.
View‑through conversions (and why they change this metric)
- Definition: a conversion that happens after a user sees (but doesn’t click) your ad and later converts within the view‑through window.
- On Google/YouTube, this concept is specifically supported; see Google’s explanation of view‑through and conversion windows in 2024–2025 under the help topic “attribution models and conversion windows” in Google Ads Help: About attribution models and conversion windows. Google also widely promotes data‑driven attribution for eligible advertisers, which affects how credit is distributed across touches; see Google Ads Help: Data‑driven attribution overview.
- TikTok also supports configurable attribution windows and explains precedence rules and view‑through logic at the ad group level; see TikTok Ads Help: Attribution settings at the ad group level and additional guidance on view‑through concepts in TikTok Ads Help: Attribution overview.
- Practical takeaway: your Impression to Conversion Percentage will be higher when you include view‑through conversions, especially for upper‑funnel creative. Always disclose whether your numerator includes VTC.
What counts as an “impression” anyway?
- Most platforms count an impression when the ad begins to render; see industry guidance for impression measurement in the IAB Desktop Display Impression Measurement Guidelines.
- Some teams prefer “viewable impressions” (a stricter standard: generally at least 50% of pixels in view for 1 second for display and 2 seconds for video) per MRC/IAB; see the threshold descriptions in the IAB/MRC Viewable Impression Guidelines and the 2024 explainer for retail media in IAB/MRC Retail Media Measurement guidelines explainer (Jan 2024).
- Tip: If your denominator is viewable impressions, say so. Your percentages will differ from “served impression” math.
How GA4 fits (and doesn’t)
- GA4 focuses on event‑based, cross‑channel attribution and model comparisons, with configurable lookback windows; see GA4 Help: About attribution in Analytics and GA4 Help: Change the key event lookback window.
- GA4 doesn’t expose a simple “view‑through conversions” metric the way ad platforms do. Use linked ad platforms for explicit VTC counts and GA4 to compare attribution models and windows across channels.
Attribution models, windows, and deduplication
- Models: Last‑click will credit the final interaction; data‑driven/time‑decay split credit across touches. Under multi‑touch models, impression‑assisted touches may receive fractional credit, changing your all‑in percentage compared with last‑click.
- Windows: Platforms allow different lookbacks for clicks vs views (e.g., clicks often longer than views). Read and align your windows in each platform; Google’s configuration is described in Google Ads Help: About attribution models and conversion windows. TikTok’s ad group window settings are documented in TikTok Ads Help: Attribution settings at the ad group level.
- Deduplication within platforms: Don’t send duplicate conversion events from both browser and server without dedupe parameters. Meta explicitly requires an event_id to deduplicate Pixel and Conversions API events; see Meta Developers: Deduplicate Pixel and server events.
- Cross‑channel deduplication: If Meta claims a view‑through and Google claims a click‑through for the same order, summing platform conversions will double‑count. Use a central attribution layer to resolve identity and apply one set of windows and credit.
2025 privacy realities that affect this metric
- iOS AppTrackingTransparency reduces access to device identifiers for cross‑app tracking, impacting both impression linkage and conversion visibility; see Apple Developer: AppTrackingTransparency framework.
- Safari’s Intelligent Tracking Prevention curtails cross‑site cookies, limiting client‑side tracking longevity; see the overview on WebKit: Tracking Prevention.
- Chrome’s Privacy Sandbox and third‑party cookie deprecation change how attribution and measurement work on the web; see Privacy Sandbox overview and Google’s preparation guidance in Google Ads Help: Prepare for third‑party cookie deprecation.
- Practical takeaway: Your numerator (conversions) can be under‑captured without server‑side integrations and identity resolution. Expect impression‑based percentages to improve when you fix data loss.
A practical reporting playbook
- Declare your rules up front
- Denominator: served impressions or viewable impressions?
- Numerator: click‑through only, or click‑through + view‑through?
- Windows: specify click and view lookback (e.g., 7‑day click, 1‑day view), and whether you apply them uniformly across channels.
- Report both the percentage and CPTI
- CPTI (conversions per 1,000 impressions) makes CPM buys comparable across channels and placements.
- Segment for insight
- Break down by audience, placement, creative, and frequency. Watch for diminishing returns as frequency increases.
- Align and reconcile
- Harmonize attribution windows where feasible; reconcile platform vs GA4 differences by documenting denominators and inclusion rules.
- Harden your data capture
- Use server‑side tracking and identity resolution to mitigate signal loss from ATT/ITP/Sandbox.
Shopify‑centric scenarios to make this concrete
- Upper‑funnel paid social with low CTR but real VTC: Your click‑only percentage might look poor, but the all‑in percentage shows meaningful incremental buyers. Use CPTI to compare creatives and cap frequency when CPTI flattens.
- Meta vs Google Display normalization: CPMs differ. Comparing CPTI (and resulting CPA) helps you see which inventory turns impressions into orders more efficiently, independent of CTR.
- iOS signal recovery: Implementing server‑side feeds and first‑party identity matching often increases recognized conversions in your numerator, lifting the all‑in percentage even when impressions are unchanged.
Where Attribuly helps
- Server‑side tracking and identity resolution: Attribuly connects impressions and downstream conversions across devices and channels—even when cookies or mobile IDs are missing—so your numerator (CTC + VTC) is more complete.
- Multi‑touch attribution and deduplication: Instead of summing overlapping platform claims, Attribuly applies one set of windows and a chosen model (last‑click, time‑decay, data‑driven) to produce a clean Impression to Conversion Percentage across Meta, Google, TikTok, email, and more.
- Shopify‑native alignment: Orders and revenue flow directly from Shopify, letting you segment this metric by product, collection, new vs returning customer, and creative.
- GA4 enhancement and data lake export: Push unified metrics to GA4/BigQuery for downstream modeling and MMM, while explaining any methodological differences in your reporting.
- Activation loops: Use Attribuly’s segmentation to retarget cohorts over‑exposed with low CPTI, and trigger workflows when impression efficiency dips.
Common pitfalls (and how to avoid them)
- Mixing definitions: Don’t plot “CVR” from one platform (per click) against Impression to Conversion Percentage (per impression) from another. Label metrics clearly and keep denominators consistent.
- Double‑counting view‑throughs: If two platforms both claim the same order, your all‑in percentage is inflated. Centralize deduplication before computing.
- Misaligned windows: A 1‑day view vs a 7‑day view setting will materially change VTC. Align or at least disclose.
- Ignoring frequency and creative fatigue: Rising frequency with flat CPTI may mean it’s time to rotate creative or tighten audience targeting.
- Mixing served and viewable impressions: State which you use; switching mid‑period breaks trending.
Mini glossary
- Impression: an ad served/begins to render; optionally use “viewable impression” per MRC/IAB thresholds.
- CTR: clicks ÷ impressions.
- Conversion rate (click‑based): conversions ÷ clicks (ad platforms) or conversions ÷ sessions/users (web analytics).
- View‑through conversion (VTC): a conversion after an impression with no click within the view window.
- CPTI: conversions per 1,000 impressions.
- MTA/DDA: multi‑touch attribution / data‑driven attribution models that split credit across touches.
- Lookback window: the time span during which a touch can receive credit for a conversion.
Key takeaways
- Always state your denominator (served vs viewable impressions), numerator (CTC vs CTC+VTC), and windows. Report the click‑only and all‑in versions when in doubt.
- Use CPTI alongside CPM and CPA for apples‑to‑apples channel comparisons.
- Expect differences between platforms and GA4 due to denominators, windows, and identity. Fix capture via server‑side tracking and resolve attribution centrally.
If you want a unified, deduplicated, and Shopify‑aligned view of Impression to Conversion Percentage across Google, Meta, TikTok, email, and more, explore Attribuly: https://attribuly.com/
References and further reading
- Viewability thresholds and impression definitions: IAB/MRC Viewable Impression Guidelines and the 2024 overview in IAB/MRC Retail Media Measurement guidelines explainer
- Google Ads attribution/windows and DDA: Google Ads Help: About attribution models and conversion windows and Google Ads Help: Data‑driven attribution overview
- GA4 attribution and lookback: GA4 Help: About attribution in Analytics and GA4 Help: Change the key event lookback window
- TikTok attribution: TikTok Ads Help: Attribution settings at the ad group level and TikTok Ads Help: Attribution overview
- Meta deduplication (Pixel + Conversions API): Meta Developers: Deduplicate Pixel and server events
- Privacy changes: Apple Developer: AppTrackingTransparency framework, WebKit: Tracking Prevention, and Privacy Sandbox overview
