Identifying Hidden Sales Funnel Leaks: Key Metrics to Monitor (2025)
If you manage a Shopify or DTC store in 2025, you probably review conversion rate, AOV, and ROAS daily. Yet the stalls that cost you the most often hide in the micro-steps: PDP to add-to-cart on mobile, payment errors on a specific gateway, or misattributed sales masking a mid-funnel content gap. This guide distills what practitioners actually do to find and fix those invisible leaks—using defensible metrics, a repeatable audit workflow, and tooling you already run (Shopify, GA4) plus an attribution layer like Attribuly.
What we mean by “hidden leak”
- Unseen drop-offs inside steps you assume are healthy (e.g., PDP → ATC looks fine overall, but new mobile visitors on a specific collection are tanking).
- Data collection issues that distort where value is created (e.g., last-click over-crediting brand search while first-touch discovery is starving).
- Segment-level friction that disappears in aggregate (device, geo, creative, offer, or new vs. returning).
Key idea: Start bottom-of-funnel for impact (checkout and payment) and work upward to discovery, validating your tracking integrity at each step.
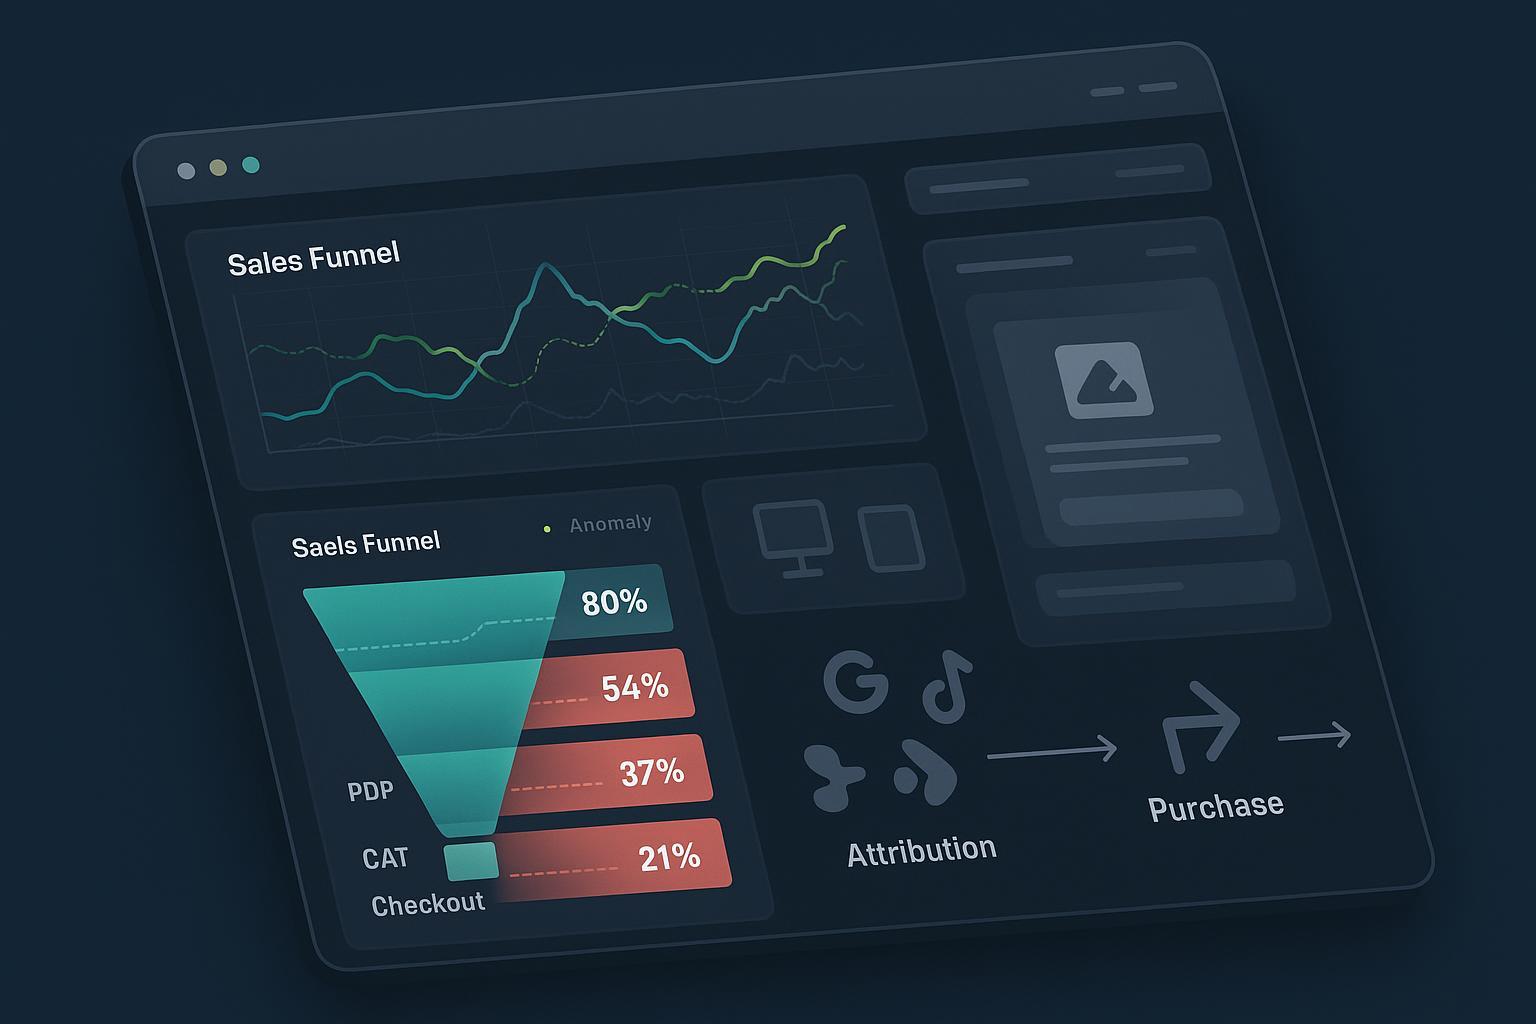
1) The essential full-funnel metrics (and how to segment them)
Below is a pragmatic metrics checklist you can implement now. Segment every metric by at least: device (mobile/desktop), new vs returning, traffic source/campaign, and top 10 products/collections.
Awareness and session quality
- Sessions by source/medium/campaign and share by device
- Engaged sessions (GA4) and bounce rate proxies (landings with <10s dwell)
- First-touch vs. last-touch contribution (assist rate)
Product discovery and consideration
- PDP views per session; PDP exit rate
- PDP → ATC rate by device and by product type
- Search usage and zero-result queries
- Content engagement: size guide clicks, reviews expansion, image zooms (track as events)
Cart and checkout
- ATC → Cart view; Cart → Checkout start
- Checkout step-through: start → shipping → payment → purchase
- Payment method usage and failure rate by provider
- Coupon application and error rate; shipping calculator interaction
Purchase and immediate post-purchase
- Conversion rate (by device, source, product)
- Average order value (AOV) and discount dependence
- Refund/chargeback rate by channel and product
Retention and loyalty
- Returning customer rate and repeat purchase rate (cohorted)
- Time to second purchase (T2SP) by product and channel
- Subscription activation/retention (if applicable)
Benchmarks to anchor expectations
- For overall ecommerce conversion, directional ranges cluster around ~1.4%–3% across sectors, with higher tiers beyond 3% for top performers, per Shopify and industry roundups (2024 context) as summarized in the Adobe ecommerce conversion rate benchmarks explainer and Shopify’s metrics guidance. Device gaps persist, with mobile typically converting lower than desktop per Statista’s industry/device conversion summaries.
- Cart/checkout abandonment around 70% remains common. Baymard’s 2024 work documents the pattern and why it happens—excessive friction, form fields, and cost clarity—see the Baymard Current State of Checkout UX (2024).
- PDP → ATC expectations vary widely by vertical and device. Many public, precise distributions are behind benchmarking tools; for directional context and device trends, consult the Contentsquare Digital Experience Benchmarks (2025) and their 2024 Explorer for KPI distributions.
Practitioner note: Use these benchmarks as guardrails, not gospel. Your best comparator is your own cohort baselines over time.
2) A modern funnel leak audit workflow (weekly/monthly cadence)
Set your cadence
- Daily/weekly: bottom-of-funnel health, anomalies, device gaps, and top-traffic campaigns.
- Monthly: cohort retention, time to second purchase, assisted conversions, channel contributions.
Instrumentation sanity check
- Confirm key events are firing once (and only once), with clean parameters across Shopify, GA4, and your attribution layer.
- In Attribuly, enable event capture for product views, ATC, checkout steps, payment info, and purchase; identity stitching helps unify journeys across sessions and devices—see Attribuly real-time visitor behavior.
Server-side tracking and CAPI
- If you haven’t already, stand up server-side tracking (sGTM) and Meta’s Conversions API to recover iOS and cookie-loss underreporting. Meta and practitioners report meaningful improvements in match rates and downstream CPA/conversion metrics in aggregate; summaries like Littledata’s Meta CAPI FAQ (2024) and Stape’s CAPI Gateway vs. sGTM primer outline when server-side methods help.
- Attribuly’s Meta integration supports CAPI with enriched identifiers and audience syncs to improve targeting fidelity; reference Attribuly’s Meta Ads integration.
Visualize the funnel and slice by segment
- Build a bottom-up funnel: Purchase ← Payment info ← Checkout start ← ATC ← PDP.
- Compare segments: device, new/returning, campaign, and product/collection. Unexplained gaps (>10–20% relative delta sustained for a few days) trigger investigation.
Investigation playbooks by stage
- PDP → ATC
- Check mobile PDP load time and image CDN; validate above-the-fold ATC visibility and sticky CTA.
- Verify size guide, reviews, and trust badges are present and visible; track clicks as micro-events.
- Look for specific product/variant stock or shipping constraints suppressing intent.
- Cart → Checkout start
- Surface shipping costs early; show delivery estimates on cart.
- Reduce distractions: limit cross-sells if they push users into loops; measure cart page exits.
- Validate coupon entry UX and error messaging.
- Checkout step-through
- Form friction is the top killer. Baymard’s 2024 analysis shows that reducing unnecessary fields is more impactful than simply reducing steps; average checkouts still include ~11+ fields and users abandon when flows feel “too long/complicated”—see Baymard’s average checkout flow and form fields (2024).
- Test express pay options (Shop Pay, Apple Pay, PayPal) and ensure parity across devices.
- Monitor payment failures by gateway and bin-range; chase down sudden spikes.
Alerting
- Set automated anomaly alerts for key ratios (e.g., checkout completion, payment success, PDP → ATC by device) when they deviate >20% week-over-week or exceed 2 SD from trailing 30-day average.
Document and prioritize
- Rank leaks by revenue impact: size of affected traffic x drop magnitude x revenue per session. Fix the highest impact first.
3) Advanced attribution: stop leaks that your last-click model can’t see
Why it matters
- Last-click tends to over-credit lower-funnel captures (brand search, retargeting) and under-credit discovery/education. This masks mid-funnel leaks and leads to starving the content and prospecting that actually fill carts.
- In 2023–2025, platforms moved toward data-driven, multi-touch models. Google made Data-Driven Attribution the default for Ads accounts; see the Google Ads DDA default announcement. Independent commentary weighs pros and cons for practitioners in pieces like Search Engine Land’s DDA analysis (2025).
How to use MTA to expose hidden leaks
- Path analysis: Look at assist rates for first-touch social/video and mid-funnel content. If assisted paths are strong but last-click looks weak, you’re likely underfunding those stages.
- Attribution lag: Examine typical days-to-convert by channel. If you cut budget before the lag window closes, you manufacture leaks.
- Creative/offer mapping: Pair path insights with creative IDs to find which messages drive micro-conversions (product discovery, size guide use) even if they rarely close.
Applying this in Attribuly
- Stitch journeys across anonymous and known visits to see the real sequence of touches and micro-events; review multi-touch paths and assist contribution in context—see Attribuly real-time visitor behavior.
- Build high-intent segments (e.g., “viewed PDP twice + used size guide but no ATC”) and sync audiences to Meta or email for retargeting via Attribuly’s Meta Ads integration.
- Stream raw events to BigQuery for custom BI and incrementality testing pipelines using Attribuly’s integrations list.
What not to do
- Don’t claim victory on ROAS when you’ve simply shifted credit to lower-funnel. Pair MTA with holdout/incrementality tests and MMM where budgets allow. Use MTA to guide hypotheses, not to end the conversation.
4) Post-purchase and retention: where “invisible” churn lives
Why this is a leak
- Most DTC profit is made on the second and third purchase. If your lifecycle program underperforms, acquisition dollars leak away quietly.
Metrics and practices
- Returning customer rate and repeat purchase rate by cohort. Shopify highlights these as core health KPIs for ecommerce operators; see the 2024 overview in Shopify’s key ecommerce metrics guide and their enterprise performance analysis primer in Shopify Enterprise ecommerce data analysis.
- Time to second purchase (T2SP). Track by product type and acquisition channel; consumables should compress T2SP.
- Segment attrition: Where are customers failing to repurchase—by device, geography, or product?
Actions that work
- Post-purchase education flows: content that helps customers use the product and lowers return risk.
- Timed replenishment or accessory offers tied to expected consumption/use windows.
- VIP and referral nudges for high-LTV cohorts.
How Attribuly helps
- Build lifecycle segments based on real behavior (e.g., “Purchased once, high PDP engagement pre-purchase, >30 days since purchase, no warranty registration”) and sync to email/social for targeted campaigns via Attribuly’s integrations list. If you run Klaviyo or similar, use segments to populate flows.
5) Top 10 hidden-leak pitfalls—and what to do instead
- Treating overall conversion rate as the truth
- Fix: Always split by device, new/returning, campaign, and top products.
- Ignoring checkout form friction
- Evidence: Baymard (2024) documents that excessive fields drive abandonment; focus on field minimization more than step count—see Baymard on average checkout flow and fields.
- Fix: Remove non-essential fields; enable address auto-complete; test guest checkout.
- Starving upper/mid-funnel due to last-click bias
- Fix: Use data-driven or multi-touch models and examine assist paths; reference Google Ads’ DDA default and practitioner commentary like Search Engine Land 2025.
- Letting mobile UX lag desktop
- Evidence: Mobile conversion trails desktop across industries; see Statista’s device conversion comparisons.
- Fix: Audit mobile PDP speed, ATC visibility, express pay, and thumb-friendly inputs first.
- Hidden payment failures
- Fix: Monitor payment success by provider and BIN; set alerts for spikes; add fallbacks.
- Underestimating the impact of transparent shipping costs
- Evidence: Transparent costs reduce abandonment; Baymard’s 2024 checkout research highlights clarity on totals and delivery as decisive—see Baymard’s checkout UX overview.
- Fix: Surface cost estimates early (PDP/cart); show delivery dates.
- Sloppy event hygiene and duplicate firing
- Fix: Validate with GA4 debug and server logs; deduplicate pixel/server events; centralize via server-side tracking. For server-side rationale, consult Littledata’s Meta CAPI FAQ (2024).
- Chasing vanity averages instead of cohorts
- Fix: Build cohorts by acquisition month/product; monitor T2SP and repeat rates.
- No anomaly alerting
- Fix: Implement alerts when key ratios shift >20% week-over-week. Investigate quickly.
- One-size-fits-all remarketing
- Fix: Build behavior-based segments in Attribuly (e.g., “high intent, no ATC”) and sync to channels via Attribuly’s Meta integration.
6) An anonymized, practitioner-style mini case
Context
- Mid-market Shopify brand in apparel; revenue concentrated on mobile; performance flat despite stable spend.
What we saw
- Overall PDP → ATC looked fine, but slicing by “new mobile visitors” on a core collection showed a multi-week decline. Journey data showed these users viewing size guides and reviews but not tapping ATC. Checkout completion and payment success were normal—pointing to mid-funnel friction rather than BOFU issues.
What we did
- Tagged size-guide interactions and reviews expansion as micro-events; verified server-side tracking and deduplication were clean.
- In Attribuly, built a segment for “viewed PDP 2+ times, used size guide, no ATC” and synced it to Meta for creative testing. Also launched a mobile PDP variant with a sticky ATC and moved size info above the fold.
- Monitored assist paths in multi-touch views to ensure upper-funnel creators and educational ads weren’t being choked by last-click budget shifts.
Outcome
- The combination of UX change + segment-based remarketing recovered intent without shifting budget from brand search. The lesson: segment-level diagnostics plus MTA pathing revealed a leak that topline conversion masked. (We’re intentionally not quoting a lift figure without a public case study.)
7) Implementation checklist (use this for a 14-day audit)
Day 1–2: Baseline and instrumentation
- Confirm event fidelity across Shopify, GA4, and Attribuly. Ensure deduplication and parameter consistency.
- Enable server-side tracking and Meta CAPI if not already. Use Attribuly’s integration to expedite audience syncs.
Day 3–5: Bottom-of-funnel focus
- Map checkout step-through by device; quantify payment failures by provider. Fix any spikes or form friction.
- Add express payment options where missing; validate address auto-complete and guest checkout.
Day 6–8: Mid-funnel and PDP
- Slice PDP → ATC by device/product. Audit mobile PDP speed and ATC visibility.
- Track micro-events (size guide, reviews, shipping estimator). Elevate high-impact blocks above the fold.
Day 9–11: Attribution and segments
- Review assisted conversions and typical attribution lag windows.
- In Attribuly, create high-intent segments (engaged but no ATC/checkout) and sync to Meta/email for targeted tests.
Day 12–14: Retention scan
- Pull cohorts by acquisition month/channel; check repeat purchase rate and T2SP distribution.
- Launch post-purchase education/replenishment flows for at-risk cohorts; use Attribuly segments to orchestrate.
Sources and further reading you can trust
- Checkout friction and abandonment patterns remain stubbornly high. See the Baymard Current State of Checkout UX (2024) and the focus on average checkout fields and form friction (2024).
- Conversion benchmarks and device gaps: Adobe’s ecommerce conversion rate explainer and Statista’s device-by-industry conversions.
- Shopify’s performance analytics primers: Key ecommerce metrics (2024) and Enterprise analysis guidance.
- Server-side tracking rationale and CAPI: Littledata Meta CAPI FAQ (2024) and Stape’s CAPI Gateway vs sGTM overview.
- Data-driven attribution shifts: Google Ads DDA default announcement and Search Engine Land’s 2025 perspective.
- KPI distributions and macro UX trends: Contentsquare Digital Experience Benchmarks (2025).
How Attribuly fits into this playbook
- Multi-source event capture and identity resolution unify your journey view, essential for segment-level diagnostics—see Attribuly real-time visitor behavior.
- Server-side tracking and Meta CAPI integration help recover lost conversions and improve targeting accuracy—see Attribuly Meta Ads integration.
- Segmentation and audience sync let you act on the leaks you find (remarketing high-intent non-buyers, suppressing recent purchasers).
- Data lake/BigQuery streaming supports custom BI dashboards, MMM feeds, and incrementality pipelines—see Attribuly integrations list.
Ready to run a focused audit? Start by connecting Shopify and your ad platforms to Attribuly, build your critical segments, and benchmark the bottom-of-funnel this week. You can learn more or request a walkthrough at Attribuly’s homepage: https://attribuly.com/
