Understanding the Hold Rate Formula for Facebook Ads: A Key Metric for Engagement
If Hook Rate gets people to stop the scroll, Hold Rate is what keeps them watching long enough to care. In practical terms, Hold Rate is a practitioner-defined metric that estimates how well your Facebook/Instagram video ad retains viewers beyond the first few seconds. It is not an official Meta-named metric—you’ll create it yourself as a custom calculation built from Meta’s standard video metrics.
Key idea in one line: Hold Rate tells you, “Of the people who started watching, how many stayed to a meaningful milestone?”
What it’s built from (official components):
- 3-Second Video Plays: how many impressions turned into at least 3 seconds of watch time.
- ThruPlays: a view to completion or at least 15 seconds, whichever comes first, per Meta’s reporting semantics in the advertising insights API. See the current definitions context in the Meta Marketing API — Ad Account Insights reference.
Why this matters: Retaining attention past the hook is often a leading indicator of stronger click intent and more efficient acquisition. You’ll use Hold Rate alongside Hook Rate to diagnose creative quality and guide edits.
The formulas you’ll see in practice (and when to use each)
Because Hold Rate isn’t an official metric, definitions vary by team. Document yours internally and keep it consistent.
- Hold Rate (retention after the hook)
- Formula: ThruPlays ÷ 3-Second Video Plays × 100%
- Meaning: Of those who gave you at least 3 seconds, how many reached the ThruPlay threshold (completion or 15s)?
- When to use: Creative testing and storytelling diagnostics. Common in practitioner guides such as the 2023 walkthrough in Facebook Ads Insider on the hold-rate formula and the 2023 overview by Vaizle on Hook Rate and Hold Rate.
- Hold Rate (impression-based variant)
- Formula: ThruPlays ÷ Impressions × 100%
- Meaning: Of everyone reached, how many achieved a ThruPlay?
- When to use: Stricter, full-reach efficiency comparisons. This is less standardized in public write-ups; if your team uses it, label it clearly (e.g., “Hold Rate (Impr-based)”) to avoid confusion.
Tip: For very short videos (≤15s), ThruPlay aligns with completion, so both Hold Rate variants will naturally run higher at the same storytelling quality compared to longer cuts.
Hold Rate vs Hook Rate (and other video metrics)
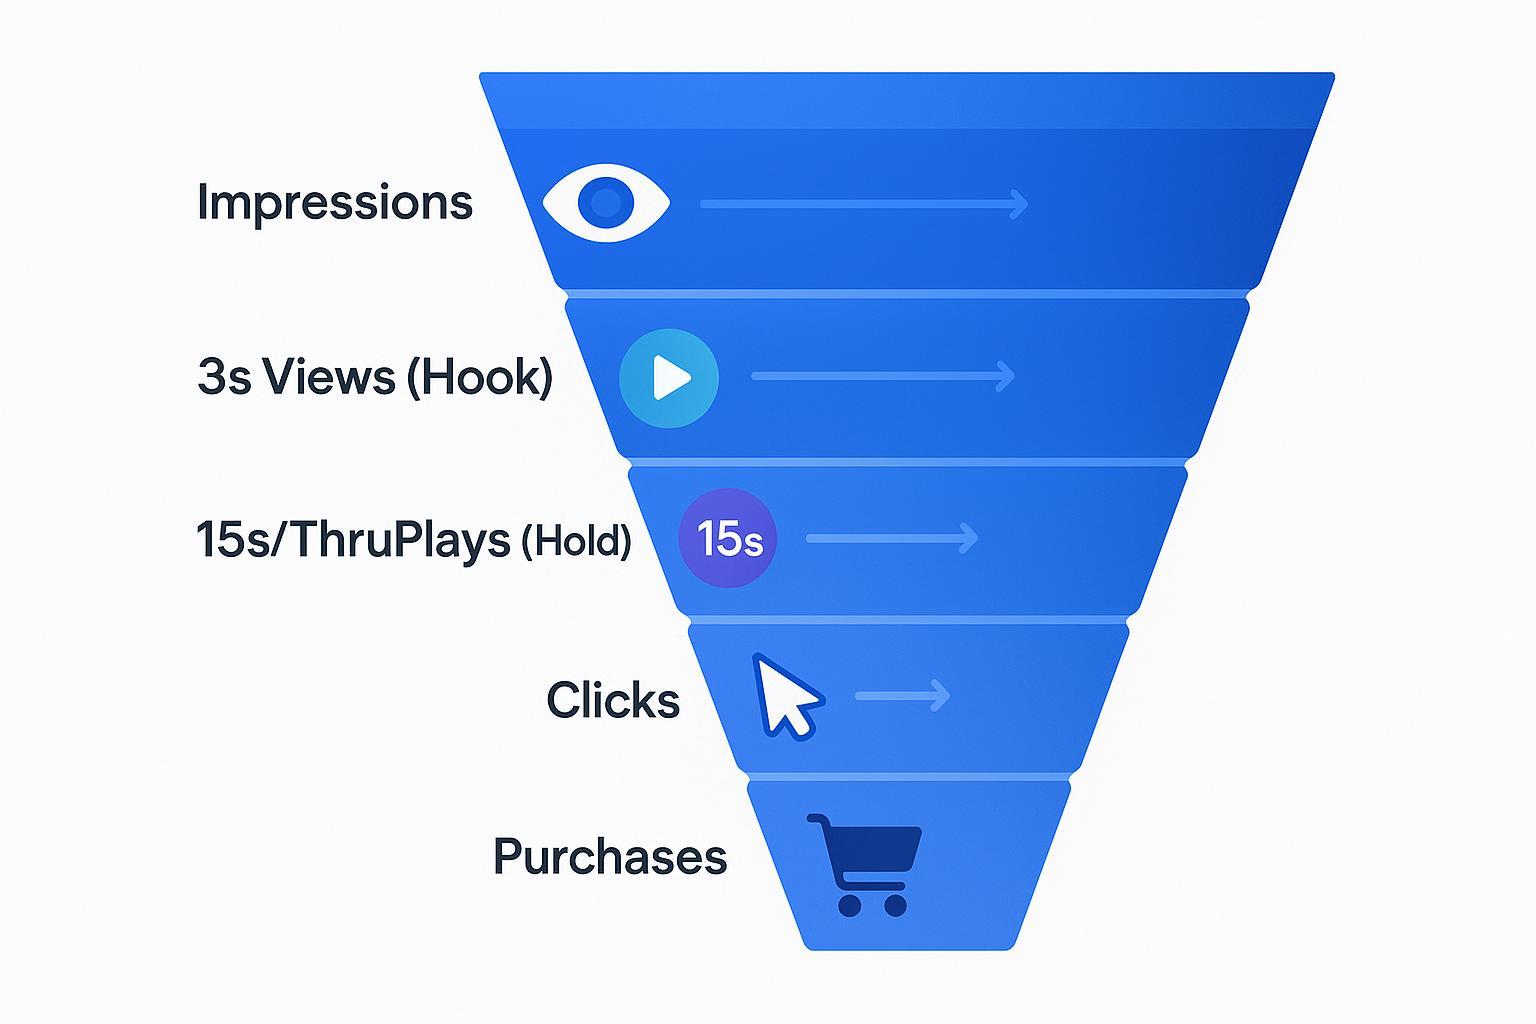
Think of the journey like a store visit:
- Hook Rate opens the door. Hold Rate keeps them in the store.
How they relate:
- Hook Rate = 3-Second Video Plays ÷ Impressions × 100% (initial attention). This hook definition and practical ranges are widely discussed by practitioners, e.g., Vaizle’s Hook vs Hold explainer (2023) and the 2024 overview from Billo on Hook→Hold metrics.
- Hold Rate (3s→ThruPlay) shows depth after the hook, toward Meta’s ThruPlay milestone. Meta’s ThruPlay behavior and related watch-time fields are documented in the Meta Marketing API — Ad Account Insights reference.
Other useful video metrics and what they tell you:
- 3-Second Video Plays: your hook “caught” attention.
- ThruPlays: viewers reached completion or 15 seconds.
- Average Play Time: aggregate depth per impression; defined in Meta’s insight references (see Ads/Instagram insights documentation like the Instagram Media Insights metrics reference).
- Audience Retention curve: where drop-offs happen over time (visible in the video’s engagement view in Ads Manager). Use it to pinpoint the exact timestamps where attention falls off.
Boundary clarifications:
- Hold Rate is not the same as completion rate. Completion rate typically uses completions ÷ starts. Hold Rate (3s→ThruPlay) focuses on 3s to ThruPlay retention.
- Hold Rate is not a platform-standard name. Teams can and do define it differently—write down yours.
What’s a “good” Hold Rate? Ranges and reality checks
Benchmarks are directional, not absolute; they vary by industry, geo, audience temperature, placement, and video length.
- Hook Rate: Many practitioners consider around 20–25% “good,” with top performers above 30%, as discussed by Vaizle (2023) on hook and hold and echoed by Billo’s 2024 summary of hook→hold metrics.
- Hold Rate (3s→ThruPlay): A commonly cited target band is roughly 40–50%+ for strong creative, with confirmation across 2023–2024 practitioner content like Vaizle’s explainer and Billo’s overview.
Interpret with care:
- Short-form bias: ≤15s videos often show higher Hold Rates since ThruPlay equates to completion.
- Placement effects: Reels, Stories, and Feed have different autoplay and UI behaviors, influencing 3s plays and ThruPlays.
How to set up a custom Hold Rate metric in Ads Manager
You’ll create a calculated metric in Ads Reporting so Hold Rate appears as a column next to your ads.
- In Ads Reporting (or the reporting area of Ads Manager), add a custom metric.
- Choose the fields and arithmetic for your chosen definition, for example: ThruPlays ÷ 3-Second Video Plays × 100.
- Name it clearly (e.g., “Hold Rate (ThruPlays/3s)”) and include the formula in the description so teammates don’t confuse variants.
- Add related columns: Impressions, 3-Second Video Plays, ThruPlays, Average Play Time.
- Open the video’s Audience Retention graph to spot drop-offs and annotate timestamps for edits.
Programmatic alternative: Pull the same fields via the Marketing API and compute Hold Rate in your BI or analytics platform using the Meta Ad Account Insights endpoint.
Diagnose and improve: a quick playbook
Use this matrix to decide your next creative move:
-
Low Hook + Low Hold
- Rework the first 1–3 seconds: pattern interrupt, fast motion, bold contrast, clear value prop immediately, captions.
-
Good Hook + Poor Hold
- Strengthen the story arc and pacing. Add early proof (UGC quote, benefit montage), clarify the offer by second 5–7, keep on-screen text readable.
-
Good Hold + Weak CPA/ROAS
- Investigate targeting, placement mix, landing-page continuity, and offer attractiveness. Consider creative–audience fit rather than pure storytelling.
-
Length & placement notes
- Compare ≤15s vs 16–30s cuts. Trim or reorder around retention-drop timestamps.
From engagement to revenue: connecting Hold Rate to outcomes with Attribuly
Creative engagement is only step one. To understand business impact, connect your video metrics to downstream events like add-to-cart, purchases, AOV, CPA, and ROAS.
How Attribuly helps e-commerce teams do this:
- Ingest your Meta fields (Impressions, 3s Plays, ThruPlays) and your defined Hold Rate into Attribuly’s data layer to analyze which creatives lead to stronger add-to-cart and purchase behavior across channels. Attribuly’s integrations and data model are designed for Shopify/DTC workflows: multi-touch attribution, server-side tracking, identity resolution, and data lake connections. See product details at Attribuly — E‑commerce marketing attribution.
- Segment by audience type, placement, geo, and product category to see where high Hold Rates also translate into lower CPA or higher ROAS.
- Use Attribuly’s AI analytics assistant to surface patterns like “creatives with higher Hold Rate correlate with stronger prospecting efficiency,” then validate with cohort and attribution views.
- If Hold Rate is strong but conversions lag, trigger retargeting via your connected tools (Meta, TikTok, email platforms like Klaviyo) using Attribuly’s segmentation and server-side events.
- Enforce UTM hygiene with Attribuly’s branded link builder so creative IDs map cleanly from Meta into your attribution and, if needed, your data warehouse for LTV analysis.
Important note: Attribuly doesn’t invent a Hold Rate metric on its own—you define it (e.g., ThruPlays ÷ 3s Plays), then Attribuly ingests the underlying fields and lets you analyze, automate, and attribute revenue against that definition.
FAQ and common pitfalls
-
Is Hold Rate an official Meta metric?
- No. It’s a practitioner-defined calculation. The underlying components (3s plays, ThruPlays) are official; the “Hold Rate” label is not.
-
Which Hold Rate formula should I use?
- For creative testing, most teams prefer ThruPlays ÷ 3-Second Video Plays. If you need a stricter, reach-normalized view, consider an impression-based variant, but label it clearly to avoid mixing apples and oranges.
-
How is ThruPlay defined again?
- A ThruPlay is counted when a video is watched to completion or for at least 15 seconds (whichever comes first), reflected in Meta’s insight semantics as referenced in the Meta Marketing API — Ad Account Insights documentation.
-
How do Audience Retention curves help?
- They show exactly where viewers drop off so you can cut or reorder scenes around those timestamps. Meta documents related watch-time fields across Ads/Instagram insights (see the Instagram Media Insights metrics reference).
-
Can I rely on one benchmark number?
- No. Treat ranges like Hook ~20–25%+ and Hold (3s→ThruPlay) ~40–50%+ as directional starting points from practitioner sources such as Vaizle (2023) and Billo (2024). Your vertical, geo, audience, and length will shift these.
Quick checklist to operationalize Hold Rate
- Decide and document your formula (e.g., ThruPlays ÷ 3s Plays).
- Add a calculated metric in Ads Reporting and label it with the formula.
- Add Impressions, 3s Plays, ThruPlays, Average Play Time columns; review retention curves.
- Diagnose with the matrix (hook vs hold vs downstream KPIs).
- Connect to revenue using Attribuly; segment results and automate retargeting for high-engagement creatives.
- Maintain UTM and creative ID hygiene so your analysis stays trustworthy.
Sources and further reading
- Meta’s video/watch-time measurement context: Meta Marketing API — Ad Account Insights reference and Instagram Media Insights metrics reference.
- Practitioner definitions and ranges: Facebook Ads Insider’s 2023 “Hold Rate Formula” walkthrough, Vaizle’s 2023 “Hook Rate and Hold Rate” explainer, and Billo’s 2024 overview of hook→hold metrics.
Ready to tie creative engagement to real revenue? Explore Attribuly for multi-touch attribution, server-side tracking, segmentation, and AI-assisted analysis: https://attribuly.com/.
