Key Metrics to Analyze in Your Facebook Ads Audit for Better ROI (2025)
If your Facebook Ads audit feels like searching for a needle in a haystack of KPIs, you’re not alone. The goal of an audit isn’t to define every metric—it’s to connect a short list of metrics to clear actions that protect profit and scale winners. This guide shares a practitioner’s playbook used with ecommerce (especially Shopify/DTC) accounts to diagnose issues, prioritize fixes, and move ROAS in the right direction.
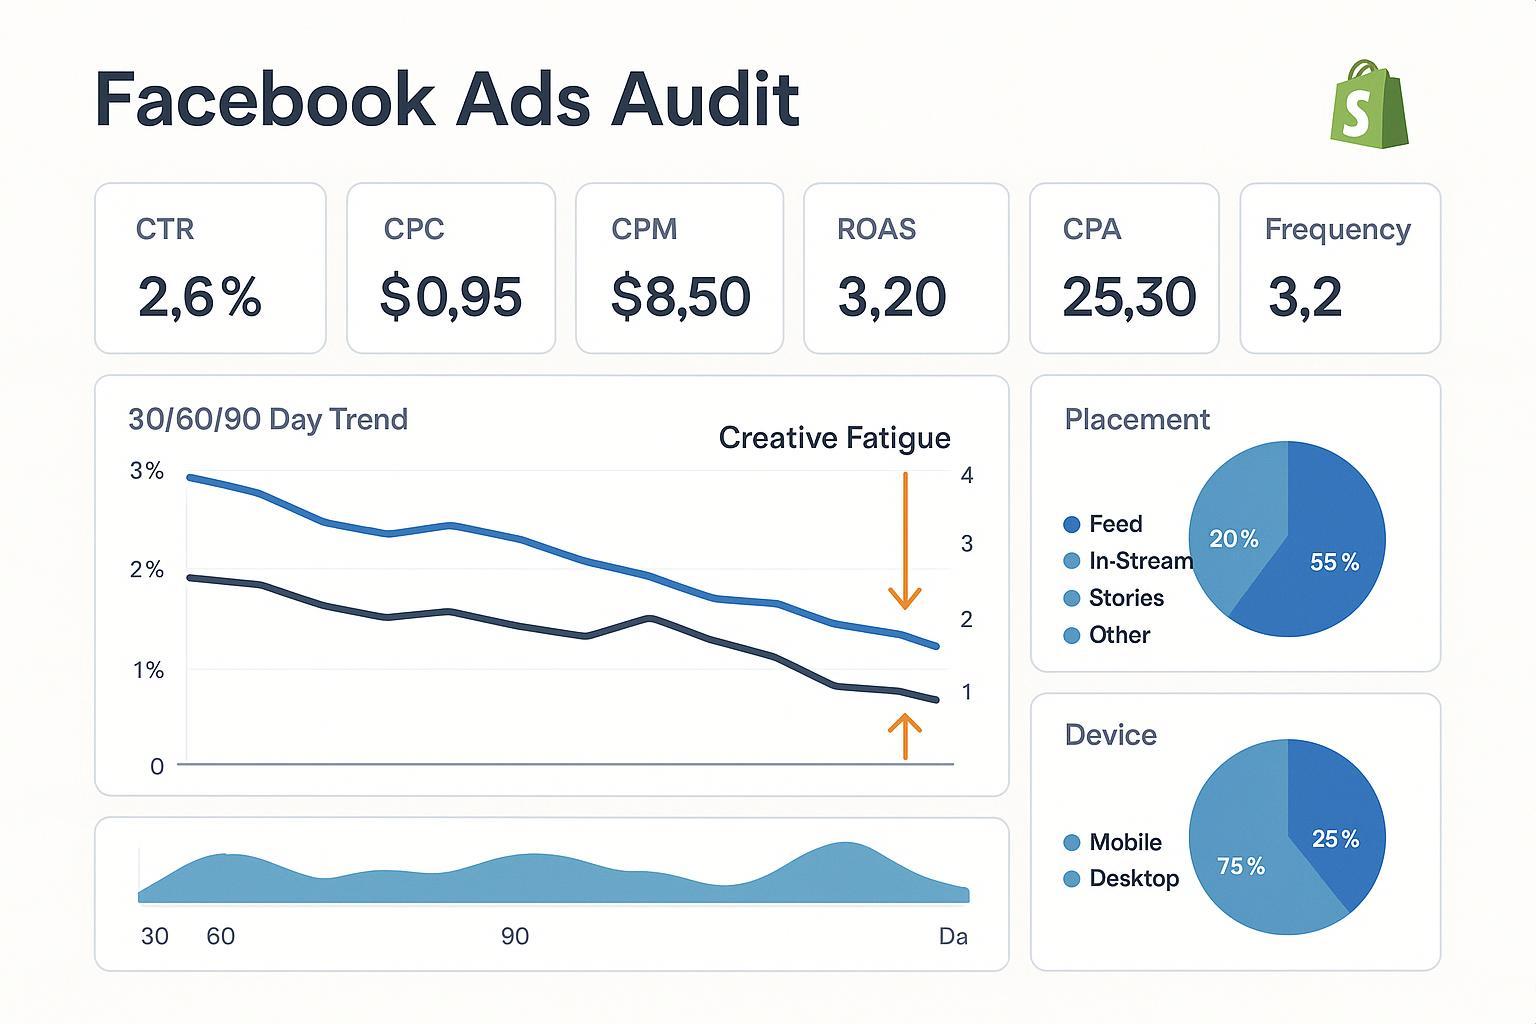
How to structure your audit (30/60/90 snapshot)
Start with a clean, comparable view before you dive into metrics:
- Time windows: last 30, 60, and 90 days side-by-side to catch trend direction vs. one-off anomalies.
- Segments to break out: funnel stage (prospecting vs. remarketing), device (iOS vs. Android), placement (Feed, Reels, Stories), and country.
- Columns to include: Spend, Impressions, Reach, Frequency, CPM, CTR, CPC, CVR (purchase), CPA/Cost per result, ROAS/Revenue.
- Stability check: flag any ad sets still in the learning phase; Meta notes performance stabilizes after roughly 50 optimization events in 7 days, and frequent edits reset learning, per the Meta “Learning phase” guidance (2025).
- Attribution alignment: confirm attribution window (e.g., 7-day click, 1-day view) matches business reality because it directly alters reported ROAS/CPA, as explained in Meta’s attribution settings overview.
Pro tip: export by campaign/ad set/ad and label rows by funnel to quickly isolate outliers (top/bottom deciles on ROAS/CPA and CTR).
The metrics that actually move ROI (and what to do about them)
Below, each metric includes what it tells you, how to interpret patterns, and the next actions to test. Definitions follow Meta’s official glossary to avoid confusion with custom columns or tool-specific naming—see Meta’s Ads metrics glossary for canonical definitions.
1) ROAS and CPA: Your primary profit levers
- What it tells you: ROAS (conversion value ÷ spend) and CPA (spend ÷ results) quantify efficiency. They’re the endpoints of your audit story.
- Benchmarks context: Public ecommerce-specific ROAS/CPA ranges vary widely by AOV, margins, and attribution window; use your historical baselines. Cross-industry references are directional only; see the 2025 rollups in TheeDigital’s Facebook Ads Benchmarks and the 2024 cross-industry context in WordStream’s benchmark report.
- Diagnose patterns:
- ROAS stable but CPA rising: check attribution window changes and conversion tracking quality.
- Both worsening: inspect upstream metrics (CTR, CVR), audience overlap, or creative fatigue.
- What to test next:
- Ensure your attribution window is consistent YoY/QoQ before making decisions, per Meta’s attribution settings.
- Improve signal quality (Pixel + Conversions API) to help delivery find buyers; see the Meta Omni Optimal Setup Guide.
2) CVR (Purchase conversion rate): Ad promise vs. landing truth
- What it tells you: How effectively clicks become purchases. A misaligned landing page, slow site, or weak offer drags CVR.
- Directional ranges: Cross-industry “conversion rate” references often cite single-digit to low double digits; treat them as broad context only. For instance, 2025 roundups referenced by practitioners (e.g., TheeDigital 2025) and compilations like Sprout Social’s 2025 Facebook stats show variability by vertical and funnel.
- Diagnose patterns:
- Healthy CTR but weak CVR: landing page speed/UX, price, or product-market fit issues.
- CVR dips after scaling: audience broadened too fast or creative promise misaligned with product page.
- What to test next:
- Sync the ad hook with the first screen of the PDP/LP; tighten message match.
- Run a speed/UX check; prioritize mobile.
3) CTR and CPC: Creative-market fit and auction cost
- What they tell you: CTR reflects creative resonance; CPC indicates cost to buy traffic given the auction and your CTR.
- Directional ranges (contextual): Many industries see CTR around ~1–3% and CPC in the ~$0.30–$1.00 band, but ecommerce can sit above/below depending on offer and market; see TheeDigital’s 2025 benchmarks and Databox’s 2025 industry aggregates as directional context.
- Diagnose patterns:
- Falling CTR with rising CPC: classic creative fatigue or audience saturation.
- Solid CTR but high CPC: auction pressure/competition; consider placements or audience expansion.
- What to test next:
- New creative angles (problem-first hooks, UGC, offer-led variants) and placements native assets (vertical for Reels/Stories).
- Adjust bid/optimization and broaden targeting to ease auction pressure.
4) CPM: Competition and signal quality thermometer
- What it tells you: CPM is your cost to reach 1,000 impressions—rises when competition heats up or when your signals make delivery less confident.
- Diagnose patterns:
- CPM spikes with no creative change: seasonal demand or audience overlap driving internal competition.
- Persistently higher CPM vs. account history: investigate overlap and signal quality (Pixel/CAPI fidelity).
- What to test next:
- Consolidate similar ad sets to reduce auction overlap; broaden where feasible.
- Improve server-side signals (CAPI) and pass richer user_data to help delivery, per Meta’s CAPI parameters guidance (fbp/fbc, hashed user data).
5) Frequency and Reach: Coverage vs. fatigue
- What they tell you: Frequency is average exposures per person; reach is unique people reached. Together, they balance coverage and repetition.
- Practical thresholds: Prospecting frequencies above ~2–4 over short windows can trigger fatigue; remarketing tolerates more. Treat these as starting points; monitor your own response curves.
- Diagnose patterns:
- Frequency climbs, CTR falls, CPM steady or rising: fatigue—your ad has outstayed its welcome.
- Low reach with high frequency: audience too narrow; consolidate or expand.
- What to test next:
- Refresh creative cadence and rotate formats; expand audiences or broaden lookalikes.
- Rebalance budget from saturated ad sets into fresher audiences/creatives.
6) Audience overlap and account fragmentation
- What it tells you: Multiple ad sets chasing the same people compete in the same auction, inflating CPM and adding volatility.
- Diagnose patterns:
- Elevated CPMs and uneven delivery across similarly targeted ad sets.
- Learning resets due to too many small budgets.
- What to test next:
- Consolidate ad sets and use broader targeting with exclusions where necessary.
- Consider campaign budget optimization to let delivery allocate to best paths. Meta’s optimization guidance emphasizes fewer, stronger signals and reduced fragmentation; see the high-level principles in Meta’s campaign optimization overview.
7) Learning phase discipline
- What it tells you: During learning, results fluctuate and are less predictive. Frequent edits prolong learning.
- Actionable rule of thumb: Aim for ~50 optimization events per ad set per 7 days and batch changes to avoid resets, per Meta’s Learning phase article.
- What to test next:
- Increase budgets incrementally; avoid daily toggling.
- Combine small ad sets; stabilize creatives before scaling.
8) Placement and device breakdown
- What it tells you: Performance can diverge across placements (Feed vs. Reels vs. Stories) and devices (iOS vs. Android)—creative fit matters.
- Diagnose patterns:
- Reels outperform Feed on CTR but underperform on CVR if the landing experience isn’t mobile-native.
- iOS CPA higher than Android: assess tracking quality and post-click UX on iOS.
- What to test next:
- Develop native assets per placement (e.g., vertical, quick-cut UGC for Reels/Stories, square carousels for Feed).
- Shift budget towards consistently higher-ROI placement/device cohorts; watch for saturation.
Creative fatigue: a focused diagnostic
You’ll often see fatigue before you feel it in revenue. Common indicators include falling CTR with rising frequency and steady or rising CPM. Practitioner experience aligns with broader guidance on fatigue signs and mitigation, such as cadence-based refreshes and audience broadening—see the discussion in Tinuiti’s fatigue guide alongside Meta’s optimization principles in their campaign optimization overview.
A fast refresh playbook:
- Rotate hooks before formats. Keep the winning structure but change the first 3–5 seconds.
- Bundle refreshes. Launch 3–5 variants at once to learn faster and avoid constant learning resets.
- Introduce offer-led angles selectively (e.g., bundles, limited-time) to spike CTR without discount addiction.
- Expand or exclude audiences to prevent overexposure while you test.
Measurement and attribution QA for Shopify/DTC
Signal quality directly affects optimization and reported ROI. Treat this as a standard line item in every audit.
- Dual sending with deduplication: Send events via Pixel and Conversions API with event_id deduplication to prevent double counting; see Meta’s Omni Optimal Setup Guide.
- Rich user data and parameters: Pass hashed email/phone and fbp/fbc parameters to improve matching and click-through attribution quality, per Meta’s Conversions API parameters guide.
- Reliable infrastructure: Consider the Conversions API Gateway for scalable, governed server-side delivery; see Meta’s CAPI Gateway setup.
- Ongoing quality monitoring: Use the Dataset Quality API and Events Manager diagnostics to iterate on event completeness and match rates.
- Shopify context: Shopify continues to evolve its server-side integrations with Meta; review the Shopify developer changelog before major tracking changes.
2025 directional benchmarks (use with care)
Benchmarks are helpful for context—but your own history beats global averages. For 2025, practitioners often reference:
- CTR: commonly ~1–3% across industries, varying by offer and creative. See TheeDigital’s 2025 benchmarks and cross-industry data from Databox (2025).
- CPC: often ~$0.30–$1.00, highly dependent on competition and CTR; see WordStream 2024 and Databox 2025.
- CVR: broad references range from mid-single digits to low double digits depending on industry and funnel stage; see context in TheeDigital’s 2025 round-up and Sprout Social’s 2025 stats compilation.
Caveats:
- Vertical, price point, and attribution window matter more than global averages.
- Use your trailing 90-day medians per funnel stage as your baseline. Aim to beat your own history.
Quick diagnostic cheat sheet
| What to check | If you see this… | Then do this |
|---|---|---|
| ROAS & CPA | ROAS down, CPA up across the board | Verify attribution window changes; check signal quality (Pixel + CAPI); stabilize learning |
| CVR | CTR steady, CVR falling | Fix LP speed/UX; tighten message match; review price/offer |
| CTR & CPC | CTR falling, CPC rising | Refresh hooks/creatives; broaden targeting; rotate placements |
| CPM | CPM spiking without creative changes | Reduce audience overlap; consolidate ad sets; strengthen server-side signals |
| Frequency & Reach | Frequency rising, reach flat | Expand audiences or exclude recent viewers; refresh creatives |
| Audience structure | Many small ad sets with similar targeting | Consolidate; use exclusions; consider CBO for allocation |
| Learning | Frequent “learning” resets | Batch edits; scale gradually; ensure ~50 events/week per ad set |
| Placement/device | Reels high CTR but low CVR | Create native, mobile-first LPs; allocate to best placement cohorts |
Two quick, anonymized field examples
-
Creative refresh in prospecting: A DTC beauty brand saw CTR slide over six weeks while frequency crept up. We launched five new variants reusing the winning structure but swapping the first 3 seconds and adding UGC voiceover. CTR recovered and CPC normalized; once CVR stabilized, we re-allocated budget toward the refreshed set.
-
Audience consolidation to reduce overlap: A mid-ticket home goods brand ran multiple lookalikes and interests that materially overlapped. We merged to broader ad sets with clear exclusions and moved to campaign budget optimization. CPM volatility eased, delivery stabilized, and we had a cleaner read on ROAS for scaling.
Note: Effects vary by vertical and margin structure; always validate changes against your 30/60/90-day baselines.
Tools to level up your Facebook Ads audit (neutral stack)
- Attribuly — Ecommerce attribution and paid channel analytics for Shopify/DTC; multi-touch attribution and server-side tracking. Disclosure: Attribuly is our product.
- Triple Whale — Shopify-native analytics with cohort and LTV views; helpful for MER and creative dashboards.
- Supermetrics — Data pipeline to BigQuery/Sheets/Looker Studio for automated multi-channel reporting.
- Elevar — Advanced server-side tracking and event piping; useful for robust Conversions API governance.
Selection guidance: Start with native Ads Manager + Events Manager diagnostics; add an attribution/analytics layer when you need cross-channel stitching, LTV or cohort views, or automated reporting.
Implementation steps: from audit to action in 7 days
Day 1–2
- Export 30/60/90-day performance by campaign/ad set/ad; segment by funnel, placement, device, and geo.
- Annotate learning status and attribution windows; flag any recent changes.
Day 3–4
- Diagnose top issues using the cheat sheet. Prioritize by business impact (ROAS/CPA first, then CTR/CVR).
- Prepare a creative refresh batch (3–5 variants) and a consolidation plan to reduce audience overlap.
Day 5
- QA measurement: confirm Pixel + CAPI with event_id dedup; pass hashed user data and fbp/fbc; review Events Manager diagnostics and Dataset Quality.
Day 6
- Launch creative refresh and structure changes in batches to minimize learning resets.
- Adjust budgets incrementally; set guardrails (e.g., ±20% daily).
Day 7
- Review placement/device cohorts; shift 10–20% budget toward the top ROI segments.
- Document baselines and set weekly checkpoints.
Appendix: Where to find each metric in Ads Manager
- ROAS, CPA/Cost per result, CVR, CTR, CPC, CPM: Customize columns > Performance or Performance & Clicks. Definitions align with Meta’s Ads metrics glossary.
- Frequency & Reach: Available at campaign/ad set/ad level; add via Customize columns.
- Learning phase status: Delivery column status; see Meta’s Learning phase reference.
- Attribution settings: At the ad set level; consider how changes affect reporting per Meta’s attribution documentation.
Next steps
If you need cross-channel clarity beyond native reports, consider trialing Attribuly alongside your current stack to validate findings and stitch revenue paths without heavy lifting.
