Exploring Average Order Value by Industry: Key Insights for E-commerce Success (2025 Benchmarks)
Average order value (AOV) isn’t just a vanity metric—it shapes your merchandising, cash flow, and paid media efficiency. In 2024–2025, AOV levels vary widely by industry, device, and platform. This guide assembles current benchmarks, explains what “healthy” looks like for your context, and offers practical tactics to lift AOV without sacrificing margin.
- Working definition: AOV = Total revenue ÷ Number of orders. It’s an order-level metric (not revenue per user or lifetime value), so always interpret AOV alongside conversion rate, contribution margin, and customer lifetime value (CLV).
Fast baselines to frame expectations
- Global AOV hovered around the mid-$140s in late 2024, with the U.S. averaging roughly the low-$150s by April 2025, per the 2025 synthesis in the OpenSend AOV statistics update (2025).
- Device and seasonality matter. App and desktop tend to drive higher AOV than mobile web; October–holiday periods often lift larger baskets.
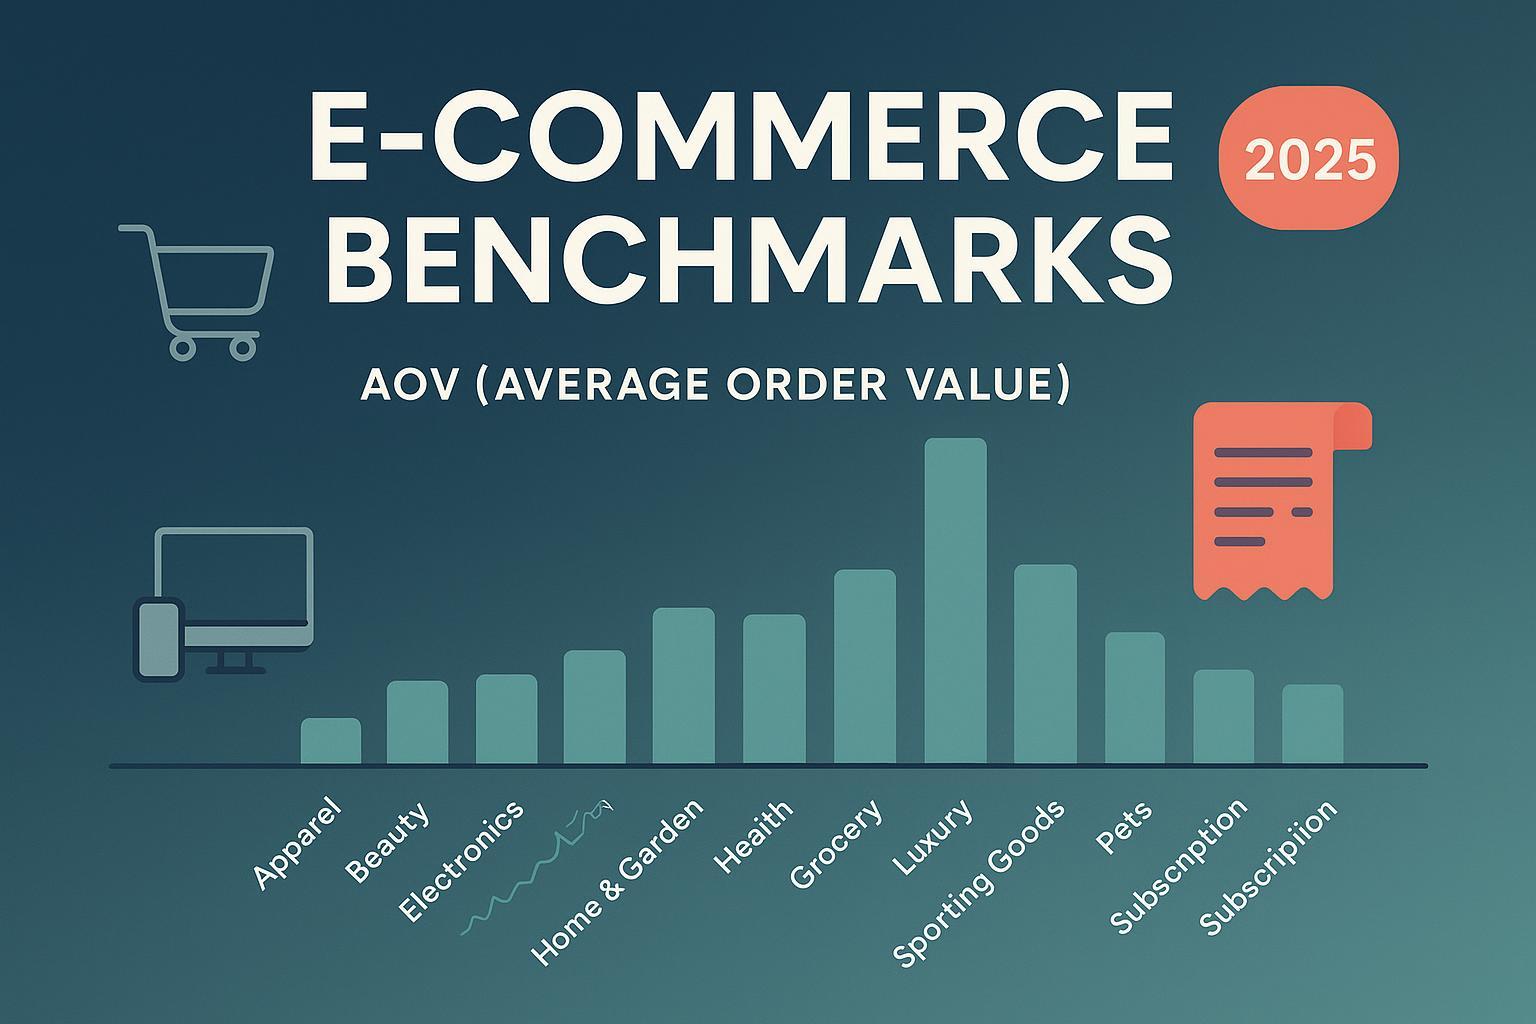
Industry AOV ranges (2025)
Note on methodology and limitations: Public, standardized AOV by industry is uneven. The ranges below synthesize recent, dated sources plus platform context. Some categories (e.g., pets, sporting goods, electronics) lack consistent public figures; treat ranges as directional and benchmark against your peer cohort where possible. Ordering is alphabetical to avoid bias.
| Industry | Typical 2025 AOV range | Notes and sources (year/region) |
|---|---|---|
| Apparel & Accessories | ~$90–$150 | Mid-range; broad variance by brand positioning and bundling. Source tag: OpenSend/industry roundups (2025), platform context. |
| Beauty & Personal Care | ~$70–$120 | Often boosted by kits/duos and subscriptions. Source tag: 2025 industry/topic briefs; category commentary. |
| Electronics | ~$150–$250 (directional) | Higher ticket, but public standardized AOVs are scarce; ranges inferred from platform trends. Source tag: 2025 platform roundups; treat as directional. |
| Food & Beverage / Grocery | ~$80–$120 (directional) | Lower-perishable baskets; repeat buyers spend more than first-time. Source tag: 2025 U.S. grocery AOV progression snapshots. |
| Health & Wellness | ~$70–$110 | Mix-driven: supplements vs devices; subscriptions lift AOV. Source tag: 2025 category tactic guides. |
| Home & Garden / Furniture | ~$150–$220 | Higher ticket and shipping-driven thresholds. Source tag: 2025 platform/vertical roundups. |
| Luxury & Jewelry | ~$300–$436 | High-ticket items push AOV up. Source tag: Oberlo and 2024–2025 sector summaries. |
| Pets | ~$90–$120 (directional) | Consumables + accessories; limited public AOV; benchmark via cohort peers. Source tag: 2024–2025 pet commerce data points. |
| Sporting Goods | ~$110–$140 (directional) | Mix-sensitive (equipment vs accessories); limited fresh public AOV. Source tag: 2025 market roundups. |
| Subscription / Boxes | ~$50–$120+ (varies) | Strong variance by vertical and tiering. Source tag: 2025 retention/personalization guides. |
Context anchors for the table above:
- Luxury & jewelry has documented sector highs near the mid-$400s in 2024; see the Oberlo sector average order value compilation (2024).
- U.S. online grocery baskets rose from first to repeat purchases between 2024 and early 2025; see Statista’s U.S. online groceries AOV progression (2025).
Device and platform split (2025)
Device
- In a 2024 benchmark across retailers, app orders recorded the highest AOV (~$217), followed by desktop (~$198) and mobile sites (~$194). This gap typically reflects saved payment methods, loyalty logins, and higher-intent audiences in apps, according to the jmango360 Mobile App Benchmark Report (May 2024).
Platform
- Shopify stores often report lower-to-mid baselines versus custom or enterprise builds; a 2025 synthesis places typical Shopify AOV around the high-$80s to low-$90s globally, with U.S. stores frequently above $100. See Red Stag Fulfillment’s Shopify AOV analysis (2025).
- Amazon’s U.S. marketplace AOV is markedly lower than most DTC stores (around the low-$50s on average; Prime Day 2024 around ~$58). See Red Stag Fulfillment’s Amazon AOV deep-dive (2025).
These platform contrasts help set expectations: if your DTC brand primarily sells via Shopify, aiming for an AOV materially above Amazon’s marketplace norm is reasonable—though product mix and pricing strategy dominate.
Is my AOV healthy? A quick diagnostic
-
Start with your industry range. Place your current AOV within the table band above. If you’re structurally below your category’s range, look at product mix (e.g., too many low-price single-item orders) and bundling.
-
Adjust for device and platform mix. Heavier app/desktop traffic can inflate AOV; a mobile-heavy audience might suppress it. On platform, Amazon marketplace will under-index versus a branded DTC store.
-
Check contribution margin and returns. Lifting AOV via discounting can backfire if margin erodes or return rates spike (common in apparel and luxury). Model AOV lift together with gross margin, shipping, and returns.
-
Segment by new vs. repeat. Many categories see repeat buyers purchase more items per order than first-time customers, especially where subscriptions (beauty, health) or pantry restocks (grocery, pets) are common.
-
Inspect source and intent. Owned channels (email/SMS) often bring higher-intent, higher-AOV traffic than some paid channels. Where public benchmarks are limited, build your own source-level targets from historical cohorts.
Mini-calculation: setting a free shipping threshold
- Baseline AOV: $85
- Proposed threshold: 125–150% of AOV → $106–$128
- Tactic: If your average shipping cost is $7 and gross margin per order is $35, test thresholds at $110 and $120. Monitor both net margin and AOV change by cohort.
The aim isn’t to maximize AOV at any cost; it’s to optimize contribution margin and cash conversion while nudging larger, profitable baskets.
How to lift AOV without hurting margin
-
Bundles and curated sets: Pre-pack complementary items (e.g., cleanser + serum + SPF; collar + leash + treats). Personalized bundles based on behavior often outperform generic sets. For a broad playbook, see the Shopify guide to AOV—benchmarks and tactics (2025).
-
Tiered free shipping thresholds: Use 125–150% of your current AOV as the first tier, then add an upper tier for VIP or app users. Test thresholds seasonally and by segment.
-
Intelligent cross-sells at PDP, cart, and checkout: Show truly complementary items, not generic bestsellers. Place small-ticket add-ons in the cart/checkout to minimize friction.
-
Financing/BNPL for higher-ticket categories: Especially relevant for electronics, furniture, and luxury—spreads payments and supports multi-item baskets. Evaluate fees vs lift and track net margin impact.
-
Loyalty tiers and personalization: Offer perks for larger baskets (e.g., free express shipping above a spend threshold), and tailor recommendations by past behavior and bundles that convert.
Measurement, instrumentation, and governance
To trust your AOV decisions, your tracking must be solid:
- Server-side tracking for stable purchase attribution across browsers and devices.
- Event taxonomy that reliably captures product views, add-to-cart, checkout start, and purchase—so you can diagnose where AOV is won or lost.
- UTM governance and channel mapping to compare AOV by source and campaign family.
- Cohort analysis to isolate whether a tactic (e.g., bundles) drove a durable AOV lift versus a one-off promo effect.
If you rely on Shopify or similar, ensure your pixel and event collection are accurate and privacy-safe. Connect your ad platforms and email so you can measure multi-touch effects on basket size and order composition over time.
Methodology and limitations (2025)
- Sources prioritized 2024–2025 dated reports and platform-specific analyses. Where category data is thin (electronics, pets, sporting goods, subscription nuances), ranges are labeled as directional.
- Device and platform contrasts are drawn from recent benchmarks and marketplace analyses; exact figures vary by region, season, and merchandising.
- Traffic-source AOV benchmarks are often gated; use your own analytics to establish source-level goals and validate tactics via cohorts.
- Update cadence: Revisit quarterly—holiday effects, pricing shifts, and mobile/app adoption can move AOV materially within a year.
Also consider: Analytics and attribution to measure AOV lifts
- For accurate multi-touch measurement of AOV and source-level diagnostics, consider Attribuly. Disclosure: Attribuly is our product.
- Shopify Web Pixels integration details for streamlined event collection: Attribuly Shopify integration
- Quick start checklist for connecting your ad/email platforms and verifying events: Attribuly Getting Started guide
References (selected, 2024–2025)
- Global/U.S. baselines and context: OpenSend AOV statistics update (2025)
- Device split: jmango360 Mobile App Benchmark Report (May 2024)
- Shopify platform AOV: Red Stag Fulfillment—Shopify AOV analysis (2025)
- Amazon marketplace AOV: Red Stag Fulfillment—Amazon AOV deep-dive (2025)
- Luxury & jewelry sector high: Oberlo—average order value compilation (2024)
- U.S. online grocery progression: Statista—AOV for U.S. online groceries, first vs repeat (2025)
- Tactics overview: Shopify—AOV guide, benchmarks and ways to increase (2025)
