Understanding Amazon’s NPS Score: What It Means for Customer Loyalty
Net Promoter Score (NPS) is a widely used metric for gauging customer loyalty and the likelihood that customers will recommend a brand. If you’re wondering, “What’s Amazon’s NPS?” you’re not alone—operators often want a yardstick to benchmark their own performance against e-commerce leaders.
Before chasing a single number, it helps to understand what NPS actually measures, whether Amazon publishes it, and how brands can put NPS to work alongside behavioral and revenue analytics.
Key takeaways
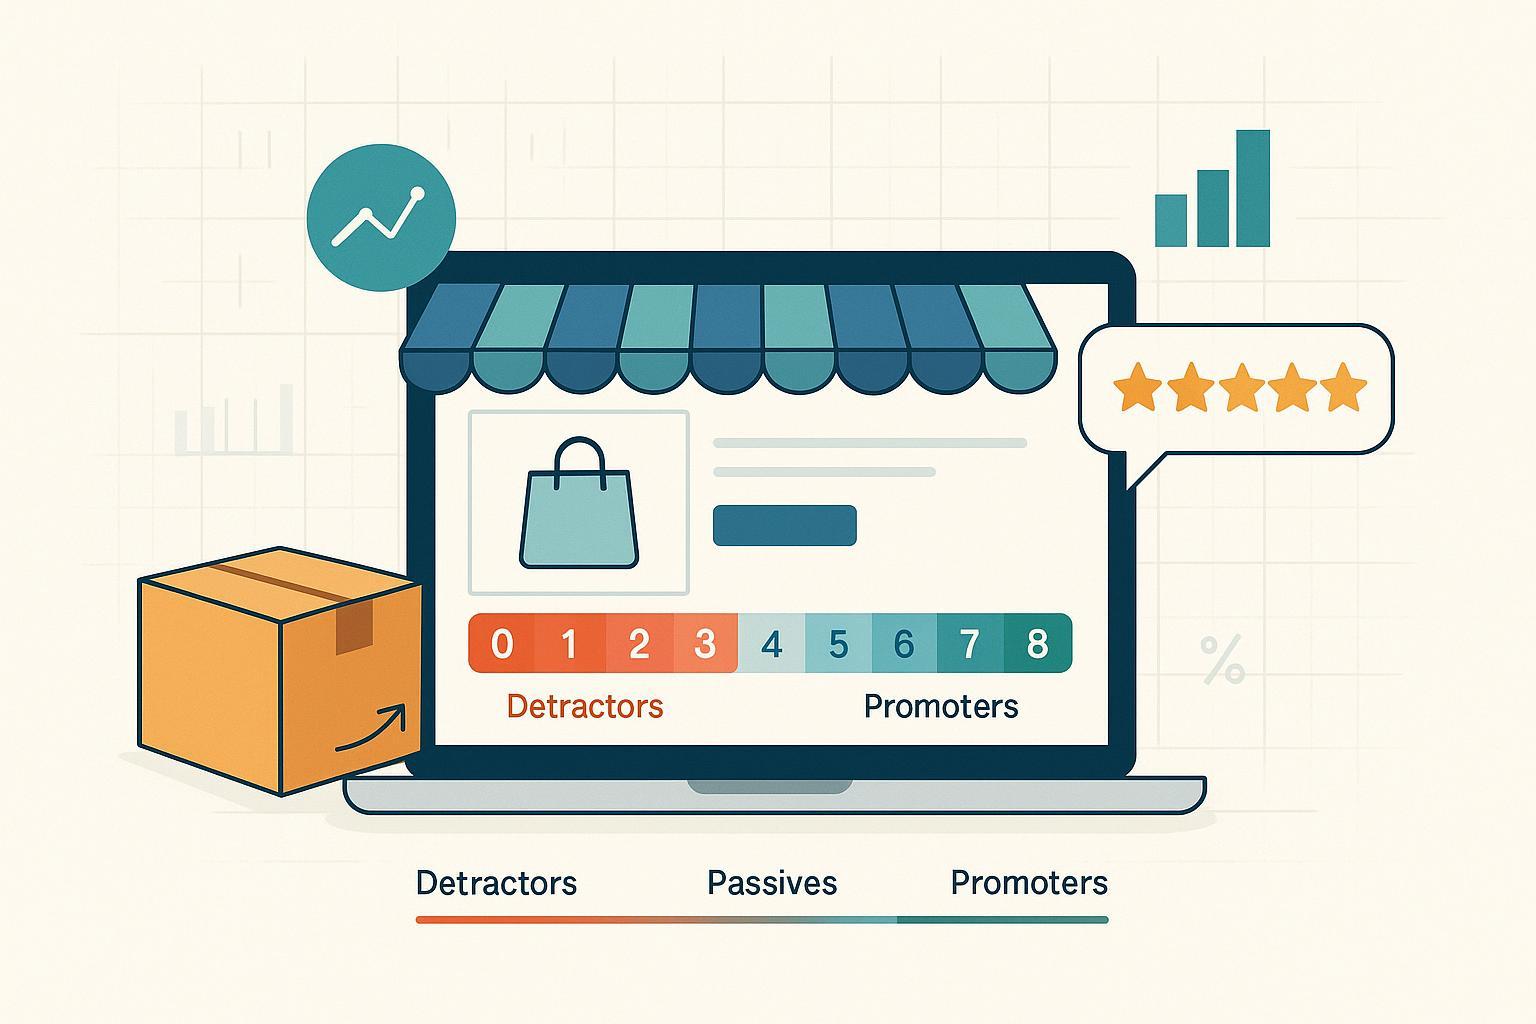
- NPS is calculated as %Promoters minus %Detractors from a 0–10 “likelihood to recommend” question; it ranges from −100 to +100.
- Amazon does not publicly disclose a customer NPS as of 2025; don’t confuse third‑party satisfaction indices with NPS.
- ACSI provides a useful sentiment proxy for online retail, but its methodology differs from NPS and should not be converted.
- Treat NPS as one signal; link it to repeat purchase, churn, and LTV to understand business impact.
- Representative sampling, qualitative “why” feedback, and close‑the‑loop practices matter more than the headline score.
What NPS is—and isn’t
NPS is based on a single question: How likely are you to recommend our company/product to a friend or colleague? Respondents answer on a 0–10 scale and are categorized as Promoters (9–10), Passives (7–8), and Detractors (0–6). The score is the percentage of Promoters minus the percentage of Detractors. For a clear explanation of categories and the formula, see the concise breakdown in the Medallia guide to the Net Promoter Score formula.
The system and its practices were developed by Bain & Company’s Fred Reichheld and collaborators, and later expanded into the Net Promoter System and “3.0” concepts; see Bain’s overview of the history of Net Promoter and the evolution toward Earned Growth in Net Promoter 3.0 (2021).
What NPS is not:
- It is not a revenue or profit metric by itself. HBR argues that linking loyalty signals to accounting outcomes (Earned Growth) yields better decisions in “Net Promoter 3.0” (2021).
- It is not a replacement for operational KPIs (delivery times, defect rates) or behavioral metrics (repeat purchase rate, churn, LTV).
- It is not universally disclosed—many companies, including Amazon, do not publish a customer NPS.
Quick calculation example
Imagine 1,000 survey responses: 520 rate 9–10 (Promoters), 300 rate 7–8 (Passives), 180 rate 0–6 (Detractors). NPS = 52% − 18% = +34. Interpreting this score still requires context: industry norms, your survey method, and how scores trend over time.
Does Amazon publish an NPS?
Short answer: No public customer NPS was found in recent investor communications. A review of Amazon’s 2023–2024 earnings materials and leadership communications shows no customer NPS disclosure—as seen in the company’s Q4 2023 earnings release and the CEO’s 2023 shareholder letter. As of today (September 10, 2025), this remains the case.
Using ACSI as context (not a substitute)
When a brand doesn’t disclose NPS, third‑party indices can still offer directional sentiment. In online retail, the American Customer Satisfaction Index (ACSI) reported Amazon at 83 in 2024 and maintained strong positioning in 2025. See the ACSI Retail & Consumer Shipping press release (2024) and the Retail Study 2025 (PDF). Important: ACSI uses its own econometric model and scale; it is not NPS and should not be converted or equated.
What’s a “good” NPS in e‑commerce?
It depends. Industry averages vary widely by sector, market, and methodology. Recent directional context from the Qualtrics XM Institute suggests industry averages across sectors in the teens, with retail often higher; see the XM Institute 2024 data snippet (PDF). Vendor roundups can add color—for example, Retently’s 2025 analysis summarizes cross‑industry ranges—but their panels and methods differ; use them as directional guides only in Retently’s 2025 “good NPS score” overview.
Practical guidance:
- Compare like‑for‑like (same geography, customer type, and channel).
- Trend your own NPS over time rather than fixating on a single benchmark.
- Pair scores with qualitative comments and behavioral data.
NPS vs. CSAT vs. CES—when to use which
- NPS (loyalty/advocacy): Use to track overall relationship health and referral propensity over time. See a concise overview in Qualtrics’ NPS fundamentals.
- CSAT (satisfaction with a specific interaction): Ideal for post‑purchase or post‑support touchpoints (e.g., “How satisfied were you with your delivery?”). See the definition and usage in the Qualtrics CSAT guide.
- CES (effort to resolve): Best for support and service interactions to pinpoint friction. Medallia’s overview explains how to measure customer service and effort.
Think of NPS as the relationship “altitude,” CSAT as the quality check after a single flight, and CES as how hard it was to get through the airport.
Run NPS well: common pitfalls and better practices
- Sampling bias: Over‑surveying a narrow slice (e.g., recent purchasers) can skew results. Ensure coverage of key segments.
- Mode and timing effects: Post‑purchase vs. post‑delivery can change sentiment; be consistent and note context.
- Score gaming: Incentivizing staff on NPS can lead to coaching or survey manipulation. Focus incentives on fixing root causes. HBR outlines misuses and improvements in “Where Net Promoter Score Goes Wrong” (2019).
- Close the loop: Act on verbatims quickly and track whether improvements shift Promoter/Detractor mix. Bain’s Net Promoter 3.0 highlights the importance of connecting loyalty and growth quality.
From signal to revenue: linking NPS to behavior
Here’s a pragmatic e‑commerce workflow:
- Survey and segment: Tag respondents as Promoters (9–10), Passives (7–8), Detractors (0–6).
- Join with behavior: For each segment, analyze 60–90‑day repeat purchase rate, average order value, and churn probability; review campaign touches and blended ROAS.
- Learn from verbatims: Identify fixable drivers (e.g., damaged packaging, late delivery, confusing returns).
- Prioritize fixes: Implement operational changes; then re‑measure NPS and track revenue cohort shifts quarter over quarter.
This aligns with the Net Promoter System’s learning loops and HBR’s Earned Growth framing, where growth from loyal customers and referrals is measured alongside NPS in “Net Promoter 3.0” (2021).
Toolbox: capturing and connecting the signals
- Qualtrics or Medallia: Full‑stack CX platforms for NPS/CSAT/CES survey design, distribution, and closed‑loop workflows. See Qualtrics’ NPS overview and Medallia’s NPS formula explainer.
- Delighted or SurveyMonkey: Lightweight tools to distribute NPS surveys across email, web, or in‑app, with simple dashboards.
- Attribuly: Can be used to connect imported NPS segments with marketing attribution, cohort analysis, and LTV, helping quantify the revenue impact of Promoters vs. Detractors. Disclosure: Attribuly is our product.
Amazon context, summarized
- There is no publicly disclosed customer NPS from Amazon as of September 2025; investor materials and shareholder letters do not report one, including the Q4 2023 earnings release.
- ACSI provides useful third‑party satisfaction signals for online retail. Amazon’s 83 in 2024 is a strong sentiment indicator within that methodology, as noted in the ACSI 2024 retail press release and the Retail Study 2025. Treat ACSI as complementary, not interchangeable with NPS.
Bottom line
NPS is a useful loyalty signal—especially when you run it well, pair it with qualitative “why,” and link it to behavioral and financial outcomes. Amazon doesn’t publish an NPS, so use ACSI and other credible indicators for context without conflating methods. Most importantly, benchmark against yourself: trend your NPS over time, close the loop on what customers tell you, and measure whether those improvements show up in repeat purchases, lower churn, and healthier growth.
